Automated Fibonacci Retracement Trading System Strategy

Overview
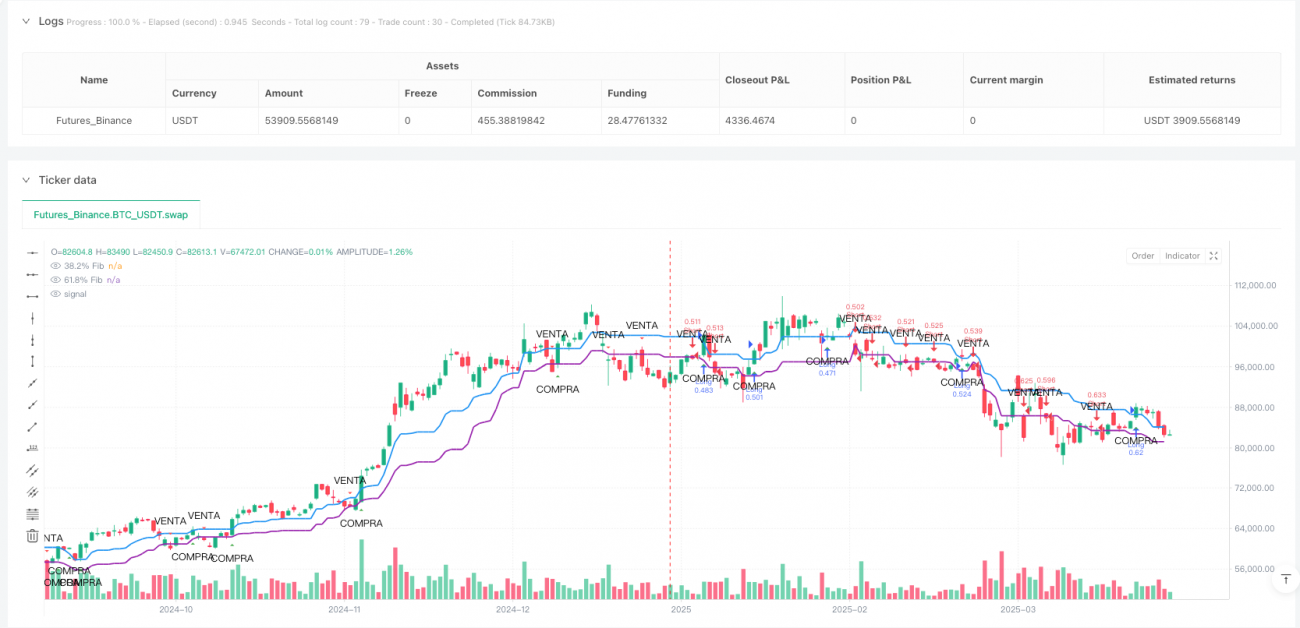
The Automated Fibonacci Retracement Trading System Strategy is a quantitative trading approach based on Fibonacci retracement levels, focusing on identifying key support and resistance areas in the market. This strategy utilizes the 38.2% and 61.8% critical Fibonacci levels, generating buy and sell signals through price interactions with these key levels. The system automatically detects price swing highs and lows, drawing Fibonacci retracement lines between these points to provide clear visual references and precise entry points.
Strategy Principle
The core principle of this strategy is based on the tendency of market prices to retrace to key Fibonacci levels after an uptrend or downtrend. The specific implementation process is as follows:
- First, the strategy identifies price swing highs and lows using a user-defined lookback period, defaulted to 20 periods.
- Using these highs and lows, it calculates key Fibonacci retracement levels, particularly 38.2% and 61.8%.
- When price crosses above the 61.8% retracement level, the system generates a buy signal, believing that the price has completed sufficient retracement and will continue the original uptrend.
- When price crosses below the 38.2% retracement level, the system generates a sell signal, indicating that the bounce may be over and the original downtrend will continue.
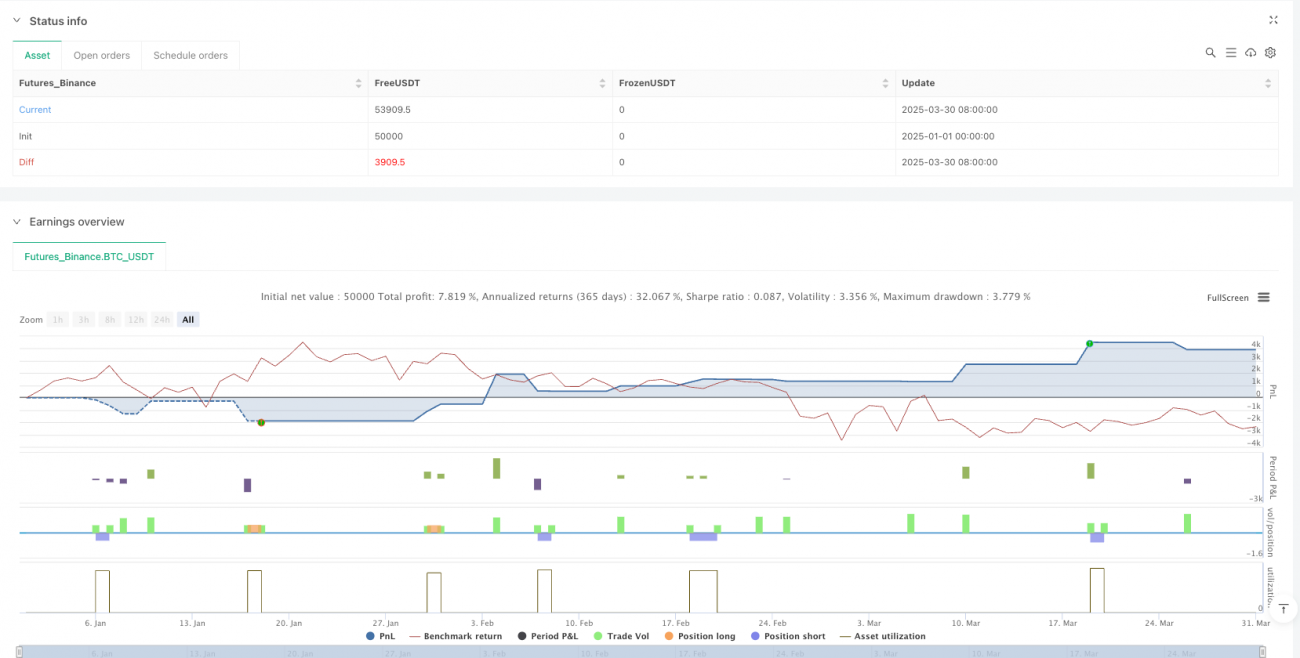
- For each trade, the strategy applies risk management based on account equity, with a default risk of 1% of account equity per trade.
- Each trade has automatic stop-loss and take-profit levels, with buy trades having a stop-loss at 99% of entry price and take-profit at 102%; sell trades have a stop-loss at 101% of entry price and take-profit at 98%.
Strategy Advantages
This Automated Fibonacci Retracement Trading System Strategy offers several significant advantages:
- Objective Entry Point Identification: Through mathematically defined Fibonacci levels, the strategy eliminates subjective judgment, providing clear, consistent entry signals.
- Adaptive to Market Conditions: The strategy doesn't rely on fixed price levels but dynamically adjusts Fibonacci levels based on recent price swings, making it adaptable to different market environments.
- Built-in Risk Management: The strategy integrates position sizing calculations based on account equity percentage, ensuring consistency in money management and risk control.
- Visualized Trading Signals: Through clear graphical markers and Fibonacci lines, traders can visually identify and confirm potential trading opportunities.
- Automated Operation: Once set up, the strategy can automatically monitor markets and execute trades, reducing emotional interference and human error.
- Adjustable Parameters: Users can adjust parameters like lookback period and risk percentage according to personal preferences and different market conditions, enhancing strategy flexibility.
- Predefined Exit Strategy: Each trade has preset stop-loss and take-profit levels, ensuring trading discipline and preventing emotional decision-making.
Strategy Risks
Despite its many advantages, there are several risk factors to be aware of:
- False Breakout Risk: Prices may temporarily cross Fibonacci levels before quickly reverting, leading to false signals and potential losses. A solution is to consider adding confirmation indicators or delayed entry conditions.
- Limitations of Fixed Stop-Loss/Take-Profit Ratios: The current strategy uses fixed percentages for stop-loss and take-profit, which may not be suitable for all market conditions, especially when volatility changes. It's advisable to dynamically adjust these parameters based on market volatility.
- Lookback Period Selection Sensitivity: Different lookback period settings will produce different swing highs and lows, affecting the positioning of Fibonacci levels. Traders should find the most suitable lookback period for specific markets through backtesting.
- Trend Reversal Risk: In strong trend reversals, the strategy may generate multiple consecutive losing signals. It's recommended to integrate trend filters to avoid trading in obvious reversal environments.
- Money Management Risk: Although the strategy includes risk percentage settings, actual losses in extreme market conditions may exceed expectations. Traders should set overall risk limits and adjust regularly.
- Parameter Optimization Overfitting: Excessive optimization of parameters may cause the strategy to perform excellently on historical data but fail in future markets. It's recommended to test parameter robustness under various market conditions.
Strategy Optimization Directions
Based on in-depth analysis of the code, here are several possible optimization directions:
-
Integrate Additional Confirmation Indicators: Adding technical indicators such as moving averages, RSI, or MACD as secondary confirmations can reduce false signals and improve strategy reliability. This avoids false signals caused by relying solely on price interactions with Fibonacci levels.
-
Dynamic Stop-Loss and Take-Profit Levels: Replace fixed percentage stop-loss/take-profit with dynamic levels based on market volatility, such as using ATR (Average True Range) to set stop-loss distance. This allows the strategy to adapt more flexibly to different volatility environments.
-
Trend Filtering: Add a trend identification component to execute trades only when consistent with the overall trend direction. For example, only execute buy signals in uptrends and sell signals in downtrends. This can be implemented using the direction of a longer-term moving average.
-
Time Filters: Add time filtering conditions to avoid trading during high volatility periods at market open or close, or avoid specific low liquidity periods based on different market characteristics.
-
Multi-Timeframe Analysis: Integrate Fibonacci levels from higher timeframes as additional support/resistance confirmation. When Fibonacci levels from multiple timeframes overlap, these areas often have stronger support or resistance effects.
-
Optimize Retracement Level Selection: Beyond the 38.2% and 61.8% levels, test the effectiveness of other Fibonacci levels (such as 50%, 78.6%), or allow users to select specific level combinations to monitor.
-
Improve Position Sizing Calculation: Further refine position sizing based on price volatility and trade expectations to ensure consistent risk exposure under different market conditions.
Summary
The Automated Fibonacci Retracement Trading System Strategy is a technically oriented quantitative trading approach that uses Fibonacci retracement principles to find high-probability trading opportunities between market swings. By automatically identifying price swings and key Fibonacci levels, the strategy provides objective entry points and clear exit rules.
The strategy's built-in risk management and visualization elements enhance trading discipline and decision-making transparency. While there are risks such as false breakouts and parameter sensitivity, these can be improved through the suggested optimization directions, such as integrating confirmation indicators, dynamic stop-loss levels, and trend filters.
Overall, this strategy provides technical analysis traders with a structured framework, particularly suitable for market participants seeking to trade based on objective support and resistance levels. With continuous optimization and appropriate risk management, the strategy has the potential to achieve stable performance across various market environments.
/*backtest
start: 2025-01-01 00:00:00
end: 2025-03-31 00:00:00
period: 1d
basePeriod: 1d
exchanges: [{"eid":"Futures_Binance","currency":"BTC_USDT"}]
*/

//@version=5
strategy("Estrategia Fibonacci con Señales", overlay=true, initial_capital=100, currency=currency.USD, margin_long=100, margin_short=100)

// 1. Configuración de Fibonacci- 1