
Overview
This strategy is a multi-indicator trend-following trading system that primarily relies on moving average crossovers, Relative Strength Index (RSI), and Bollinger Bands to jointly confirm trading signals. The strategy operates on a 15-minute timeframe, using Simple Moving Average (SMA) crossovers as the main trend determination basis, while utilizing the RSI indicator to filter overbought or oversold market conditions, and Bollinger Bands to identify potential price extreme zones. For risk management, it employs dynamic stop-loss and take-profit targets based on Average True Range (ATR), achieving adaptive adjustment to market volatility. Overall, this strategy attempts to capture short-term price movements in trending markets through the coordinated action of multiple technical indicators, while strictly controlling risk exposure for each trade.
Strategy Principles
The core principle of this quantitative trading strategy is to combine multiple technical indicators for generating and filtering trading signals, comprised of the following key components:
-
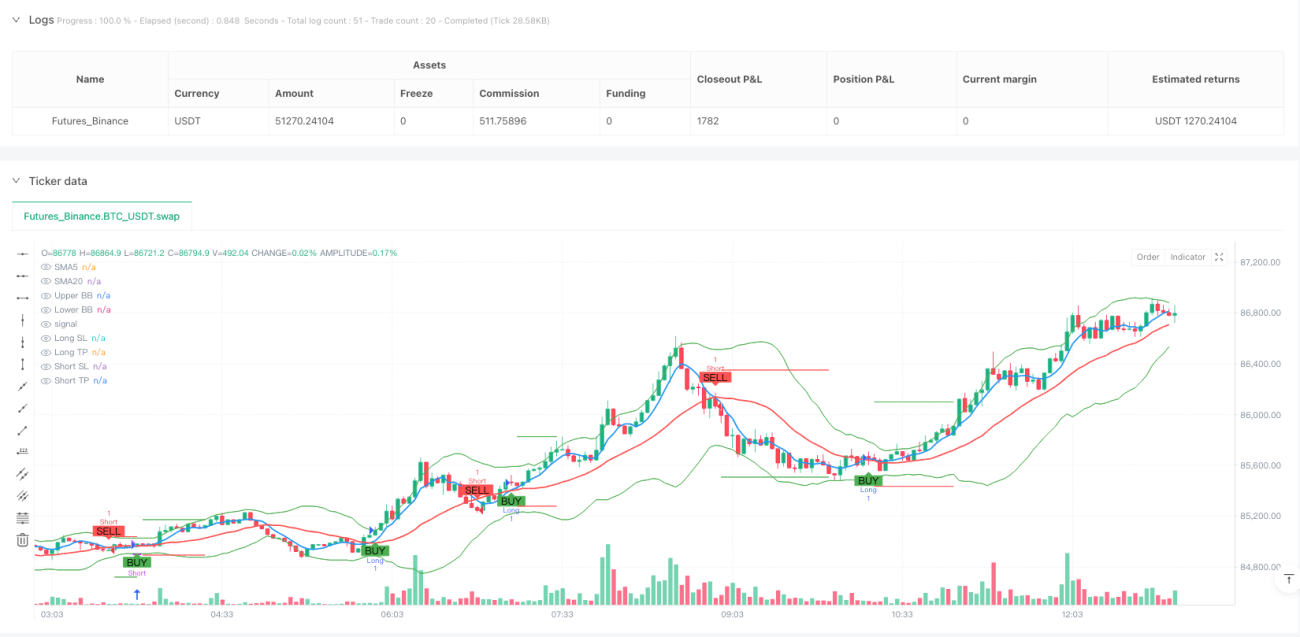
Trend Confirmation Mechanism: Uses the crossover of 5-period and 20-period Simple Moving Averages (SMA) as the primary determinant of trend direction. When the 5-period SMA crosses above the 20-period SMA, it identifies the beginning of an uptrend, triggering a buy signal; when the 5-period SMA crosses below the 20-period SMA, it identifies the beginning of a downtrend, triggering a sell signal.
-
Momentum Filtering: Uses the Relative Strength Index (RSI) to filter potential overbought or oversold states. Buy conditions require RSI below 70, avoiding entry in overbought areas; sell conditions require RSI above 30, avoiding shorting in oversold areas.
-
Volatility Range Identification: Uses Bollinger Bands to identify the relative position of price. Buy signals require price not above the upper band, and sell signals require price not below the lower band, effectively avoiding trading in extreme price areas.
-
Risk Management System: Employs dynamic stop-loss and take-profit targets based on Average True Range (ATR). Stop-loss is set at 2 times ATR distance from entry price, and take-profit is set at 4 times ATR distance, allowing risk management to adapt to volatility changes under different market conditions.
-
Position Management: The strategy stipulates that risk per trade should not exceed 1% of account capital, ensuring that single trade losses are controlled within an acceptable range.
In code implementation, the strategy first calculates the values of various technical indicators, then defines clear entry conditions and exit rules. When buy conditions are met, all short positions are closed and long positions are established, with corresponding stop-loss and take-profit levels set; when sell conditions are met, all long positions are closed and short positions are established, with corresponding stop-loss and take-profit levels set. The strategy uses the "var" keyword to save stop-loss and take-profit prices, ensuring these prices remain effective until exit conditions are triggered. Finally, the strategy includes visualization components that plot relevant indicators and signals, allowing traders to intuitively understand market conditions and trading logic.
Strategy Advantages
Through in-depth analysis of the code structure and logic, this strategy demonstrates multiple advantages:
-
Multi-Indicator Confirmation: The strategy combines three different types of technical indicators—moving averages, RSI, and Bollinger Bands—forming a signal confirmation mechanism that reduces the risk of false signals from single indicators. This multiple filtering mechanism helps improve the quality and reliability of trading signals.
-
Adaptive Risk Management: Using ATR-based dynamic stop-loss and take-profit targets allows risk parameters to adjust automatically according to market volatility. It automatically widens stop-loss ranges in high-volatility markets and narrows them in low-volatility markets, avoiding the limitations of fixed stop-losses in different market environments.
-
Combination of Trend Following and Volatility Filtering: The strategy not only tracks trend direction (through SMA crossovers) but also filters trading signals in extreme price areas through RSI and Bollinger Bands, effectively reducing potential losses during trend adjustments.
-
Clear Position Management: Clearly stipulates that risk per trade should not exceed 1% of the account, providing clear guidance for fund management and contributing to long-term stable operation.
-
Signal Visualization: The code includes comprehensive visualization components, including plotting of moving averages, Bollinger Bands, buy/sell signals, and stop-loss and take-profit levels, allowing traders to monitor strategy operation status and market conditions in real-time.
-
Explicit Entry and Exit Logic: The strategy has well-defined entry and exit rules, avoiding subjective factors in trading decisions, which helps maintain trading discipline.
-
Reverse Signal Triggers Position Closing: When reverse signals appear, the strategy first closes existing positions before establishing new positions, which helps quickly adjust position direction when market trends change, reducing exposure in the wrong direction.
Strategy Risks
Despite the comprehensive design of this strategy, there are still the following potential risks and limitations:
-
Short-term Moving Average Sensitivity: Using a 5-period SMA as the fast moving average may be overly sensitive, potentially producing frequent crossover signals in ranging markets, leading to overtrading and commission erosion. Solutions could include adding moving average smoothing or pausing trading in ranging markets.
-
Fixed Multiple ATR Stop-Loss: Although ATR is used to dynamically set stop-losses, consistently using 2 times ATR may not be flexible enough under certain market conditions. In high-volatility markets, stop-losses might be too wide; in low-volatility markets, they might be too narrow. Consider dynamically adjusting the ATR multiplier based on different market phases.
-
Fixed RSI Thresholds: The strategy uses fixed RSI thresholds (70 and 30) which may not be applicable to all market environments. In strong trending markets, RSI may remain at high or low levels for extended periods, causing the strategy to miss effective signals. Consider dynamically adjusting RSI thresholds based on market trend strength.
-
Limitations of Technical Indicator Dependence: The strategy relies entirely on technical indicators, lacking consideration of fundamental factors. Pure technical analysis may fail when major fundamental events impact the market. Consider integrating some fundamental filtering mechanisms or major event risk management rules.
-
Drawdown Risk: Although the strategy employs stop-loss mechanisms, under extreme market conditions (such as flash crashes or gaps), the actual stop-loss execution price may be far lower than the set price, resulting in unexpected losses. Consider adding maximum drawdown control mechanisms.
-
Parameter Optimization Risk: The parameters used in the code (such as 5 and 20-period SMA, 14-period RSI and ATR) may risk overfitting historical data. It is recommended to conduct robustness tests on parameters to ensure the strategy maintains relatively stable performance under different parameter settings.
-
Liquidity Risk: When executing trades in low-liquidity markets, there may be risks of expanded slippage, with actual trading results potentially differing significantly from backtesting results. Consider adding liquidity filtering conditions to avoid trading under extremely low liquidity conditions.
Strategy Optimization Directions
Based on in-depth analysis of the code, here are possible optimization directions:
-
Dynamic Parameter Adjustment Mechanism: Introduce dynamic parameter adjustment mechanisms based on market volatility or trend strength, such as increasing RSI threshold ranges in high-volatility markets or adjusting moving average periods in strong trending markets, making the strategy more adaptive. Optimization rationale: Fixed parameters perform differently across various market environments; dynamic parameters help the strategy adapt to different market states.
-
Add Trend Strength Filtering: Introduce trend strength indicators such as ADX (Average Directional Index) and only execute trading signals when trends are clear. Optimization rationale: Avoid frequent trading in ranging markets, improve signal quality, and reduce commission costs.
-
Time Filtering: Add time filtering mechanisms to avoid trading during periods of abnormal volatility or insufficient liquidity. Optimization rationale: Certain specific time periods (such as transitions between Asian, European, and American trading sessions) may have special market behavior patterns; targeted optimization can improve strategy stability.
-
Scaled Take-Profit: Implement a tiered take-profit mechanism for partial position closing, both securing partial profits and retaining the possibility of capturing major trends. Optimization rationale: The current strategy's fixed take-profit may exit strong trends too early; scaled take-profit can balance profit-taking with trend following.
-
Multi-Timeframe Confirmation: Add higher timeframe trend confirmation, only entering when aligned with the major trend direction. Optimization rationale: Trading in the direction of larger timeframe trends can improve success rates and reduce the risk of counter-trend trading.
-
Incorporate Volume Indicators: Integrate volume analysis to ensure trading signals have sufficient trading volume support. Optimization rationale: Price movements accompanied by effective volume confirmation are more reliable, helping filter false breakout signals.
-
Machine Learning Optimization: Introduce machine learning algorithms to dynamically optimize parameters or signal weights, enhancing the strategy's adaptability to market changes. Optimization rationale: Market conditions constantly change, static strategies easily become ineffective, and machine learning can help the strategy continuously adapt to market evolution.
-
Enhanced Capital Management Strategy: Dynamically adjust position sizes based on system performance, increasing positions during consecutive profits and reducing positions during consecutive losses. Optimization rationale: Improve capital utilization efficiency, maximize returns when the strategy performs well, and control risk when the strategy underperforms.
Conclusion
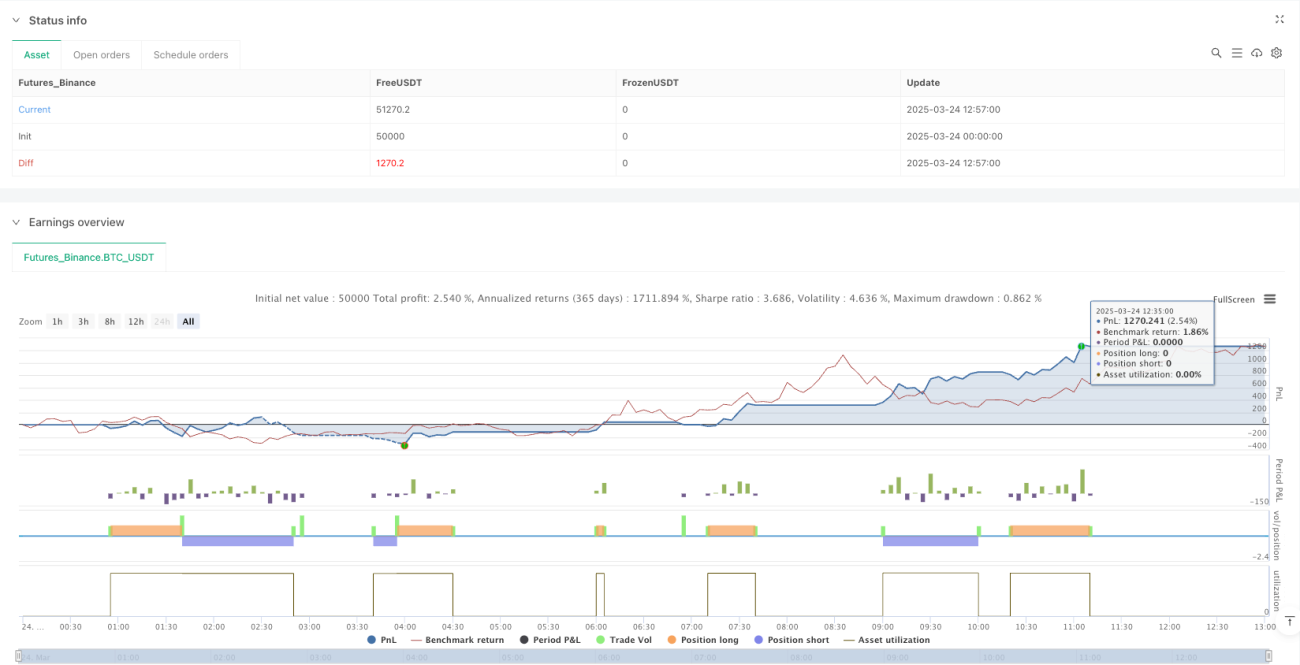
The Multi-Indicator Dynamic Crossover Trend-Following Quantitative Strategy is a comprehensive trading system combining moving average crossovers, RSI filtering, and Bollinger Band confirmation. Through the coordinated action of multiple technical indicators, this strategy effectively captures trend change points while filtering signals in extreme price areas, and implements dynamic risk management mechanisms based on ATR, achieving adaptation to different market conditions.
Although this strategy has obvious advantages such as multi-indicator coordination confirmation and adaptive risk management, it still has risks including short-term moving average over-sensitivity and fixed parameter limitations. To address these limitations, it is recommended to further enhance the strategy's robustness and adaptability through introducing dynamic parameter adjustment mechanisms, adding trend strength filtering, implementing scaled take-profit, and other optimization directions.
Overall, this is a relatively well-designed comprehensive quantitative trading strategy that provides a structured and logical systematic framework for digital asset day trading by balancing key factors such as signal generation, risk control, and position management. Through continuous optimization and parameter adjustments, this strategy has the potential to maintain relatively stable performance across various market environments.
- 1