
Overview
The Black-Scholes Volatility Breakout Trading Strategy with Dynamic Trailing Stop Optimization is an innovative trading model that combines options pricing theory with technical analysis. The core concept leverages the Black-Scholes model to estimate asset price volatility and construct dynamic upper and lower thresholds. Trading signals are generated when price breaks through these thresholds. Additionally, the strategy incorporates a flexible trailing stop mechanism that both controls maximum loss per trade and locks in profits during trend continuation. This design is particularly effective for capturing trading opportunities from short-term price anomalies, especially in high-volatility market environments.
Strategy Principles
The theoretical foundation of this strategy derives from the volatility measurement methodology in the Black-Scholes options pricing model. The implementation process is as follows:
-
First, the strategy calculates the logarithmic return of historical prices (logReturn = math.log(close / close[1])), then uses the standard deviation function (ta.stdev) to compute volatility, which is annualized (multiplied by sqrt(periodsPerYear)). The annualization process accounts for trading days (252) and trading minutes per day (390), divided by the user-defined chart timeframe.
-
Next, the strategy calculates the expected price movement (expectedMove), which is based on the product of the previous closing price, current volatility, and a time factor (sqrt(1/periodsPerYear)). This step essentially quantifies "the expected price range in the next time unit under current volatility conditions."
-
The strategy then constructs dynamic trading thresholds: the upper threshold (upperThreshold) is the previous closing price plus the expected movement; the lower threshold (lowerThreshold) is the previous closing price minus the expected movement.
-
When the price breaks above the upper threshold, a long signal is triggered; when the price breaks below the lower threshold, a short signal is triggered.
-
For risk management, the strategy employs a two-tier stop-loss protection mechanism:
- Initial stop-loss: Sets a fixed stop point based on user-defined percentage (stopLossPerc)
- Trailing stop: As price moves favorably, the stop point adjusts dynamically according to the set trailing percentage (trailingStopPerc), locking in existing profits
This design enables the strategy to effectively control risk and improve capital efficiency while capturing price breakout opportunities.
Strategy Advantages
Through in-depth analysis of the code, this strategy demonstrates the following significant advantages:
-
Solid Theoretical Foundation: The strategy is based on mature financial theory, using the Black-Scholes model for scientific volatility quantification, providing strong theoretical support.
-
Adaptive to Market Conditions: By dynamically calculating volatility and expected price movement, the strategy automatically adapts to different market environments. During low volatility periods, entry thresholds are lower; during high volatility periods, entry thresholds correspondingly increase, avoiding the limitations of fixed parameters.
-
Comprehensive Risk Management: The dual stop-loss mechanism (initial stop-loss and trailing stop) effectively controls individual trade risk while maximizing profit capture during trend movements.
-
High Computational Efficiency: The strategy algorithm is concise and efficient with strong real-time capabilities, recalculating at each price change and order execution (calc_on_order_fills=true, calc_on_every_tick=true), suitable for intraday short-term trading.
-
Visualization Aids Decision-Making: The strategy displays dynamic thresholds in chart form, allowing traders to intuitively understand current market conditions and potential trading opportunities.
-
Flexible Parameters: Users can adjust key parameters such as volatility lookback period and stop-loss percentages according to personal risk preferences and market characteristics, enhancing strategy adaptability.
Strategy Risks
Despite its sophisticated design, the strategy still has the following potential risks:
-
False Breakout Risk: The market may exhibit brief threshold breakouts followed by rapid retracements, leading to false signals. A solution could be to add confirmation mechanisms, such as requiring price to remain beyond the threshold for a certain time or integrating other indicators for signal filtering.
-
Volatility Estimation Bias: At market turning points or around major events, historical volatility may not accurately predict future volatility, resulting in inappropriate threshold settings. Consider introducing implied volatility or adaptive volatility estimation methods for improvement.
-
Slippage and Execution Risk: In high-frequency trading environments, execution prices may differ from signal prices. It is advisable to set reasonable slippage models during backtesting and use limit orders rather than market orders in live trading.
-
Parameter Sensitivity: Strategy performance is relatively sensitive to the volatility lookback period (volLookback) and stop-loss parameters. Robust parameter ranges should be identified through historical backtesting to avoid curve-fitting from excessive optimization.
-
Short Selling Risk: Potential losses in short trades can theoretically exceed initial capital. In practical applications, it is recommended to set maximum position size limits or adjust position sizes according to account risk tolerance.
-
Trend Reversal Risk: Trailing stops may be frequently triggered in oscillating markets, increasing transaction costs. Consider adding trend confirmation indicators and only enabling trailing stops when trends are clearly established.
Strategy Optimization Directions
Based on code analysis, the strategy can be optimized in the following directions:
-
Dynamic Volatility Calculation Improvement: The current strategy uses a fixed lookback period to calculate historical volatility. Consider adopting GARCH models or exponentially weighted volatility models to better capture the dynamic characteristics of volatility. This is beneficial because financial market volatility typically exhibits "volatility clustering," where recent price fluctuations have greater predictive value for the future.
-
Time Decay Factor Introduction: A time decay factor could be incorporated into the expected movement calculation, giving recent data greater influence on predictions and improving the strategy's sensitivity to market turning points.
-
Multi-Timeframe Analysis Integration: Combine longer-term volatility analysis to avoid counter-trend trading in the primary trend direction. For example, only taking positions in the direction of the daily trend to improve win rates.
-
Volume Confirmation Mechanism: Integrate volume analysis into breakout signal confirmation, only validating breakouts when accompanied by significant volume increases, reducing losses from false breakouts.
-
Adaptive Stop-Loss Mechanism: Dynamically link trailing stop percentages with market volatility, setting more flexible trailing stops in high-volatility environments to avoid triggering by normal market noise.
-
Capital Management Optimization: Introduce a dynamic position sizing module that automatically adjusts position size based on account equity, market volatility, and signal strength, balancing risk and reward.
-
Machine Learning Enhancement: Consider using machine learning algorithms to optimize parameter selection or enhance signal quality assessment, allowing the strategy to adapt more intelligently to different market environments.
Summary
The Black-Scholes Volatility Breakout Trading Strategy with Dynamic Trailing Stop Optimization is a quantitative trading solution that cleverly combines financial theory with practical trading techniques. By scientifically quantifying market volatility, dynamically constructing trading thresholds, and incorporating flexible risk management mechanisms, the strategy effectively captures trading opportunities arising from short-term price anomalies.
The core strengths of the strategy lie in its solid theoretical foundation, strong adaptability, and comprehensive risk management, making it particularly suitable for application in volatile market environments. However, users need to be vigilant about potential risks such as false breakouts and parameter sensitivity, and can optimize through improved volatility calculations, multi-timeframe analysis, volume confirmation, and other approaches.
Overall, this is an elegantly designed, logically clear quantitative trading strategy that demonstrates both a profound understanding of financial market mechanisms and strong practicality and scalability. For quantitative traders familiar with options theory and pursuing a robust trading style, this represents a strategy framework worthy of in-depth study and application.
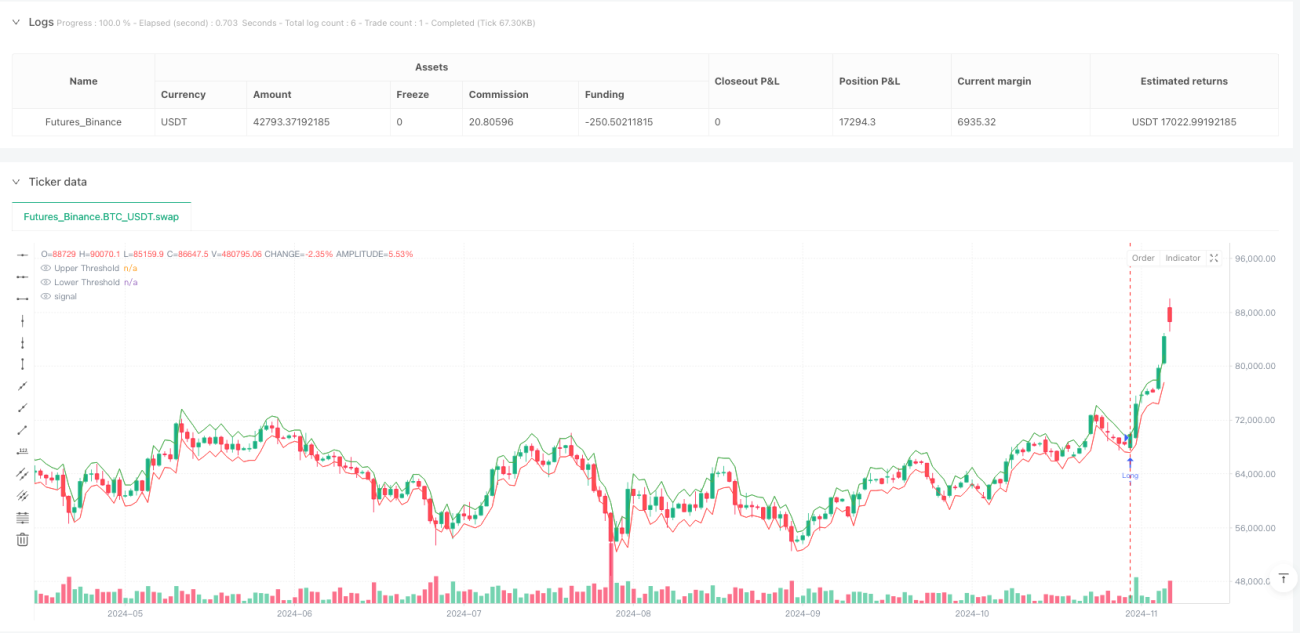
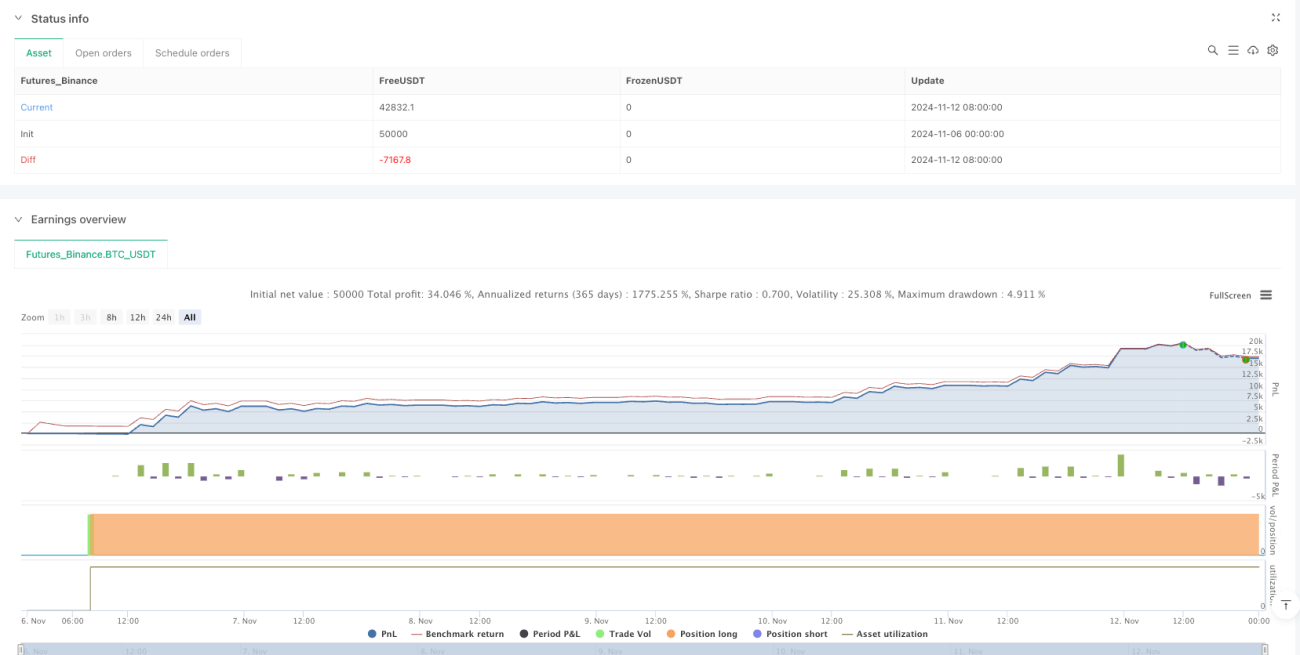
/*backtest
start: 2024-11-06 00:00:00
end: 2024-11-13 00:00:00
period: 1d
basePeriod: 1d
exchanges: [{"eid":"Futures_Binance","currency":"BTC_USDT"}]
*/

//@version=5
strategy("black-scholes breakout with trailing stop", overlay=true, initial_capital=100000, currency=currency.USD, calc_on_order_fills=true, calc_on_every_tick=true)

// User Inputs- 1