
Strategy Overview
The Dynamic Multi-Indicator Trend-Momentum Enhanced Trading Strategy is a trading system that combines multiple technical analysis indicators to capture market trends and enhance signal reliability through momentum confirmation. This strategy primarily uses Exponential Moving Average (EMA) crossovers to determine entry points, while employing the Relative Strength Index (RSI) and Moving Average Convergence Divergence (MACD) as momentum confirmation tools. It also incorporates Average True Range (ATR)-based dynamic stop-losses and an adjustable risk-reward ratio to form a comprehensive trading system.
Strategy Principles
The core logic of this strategy revolves around multi-layered technical indicator confirmation:
-
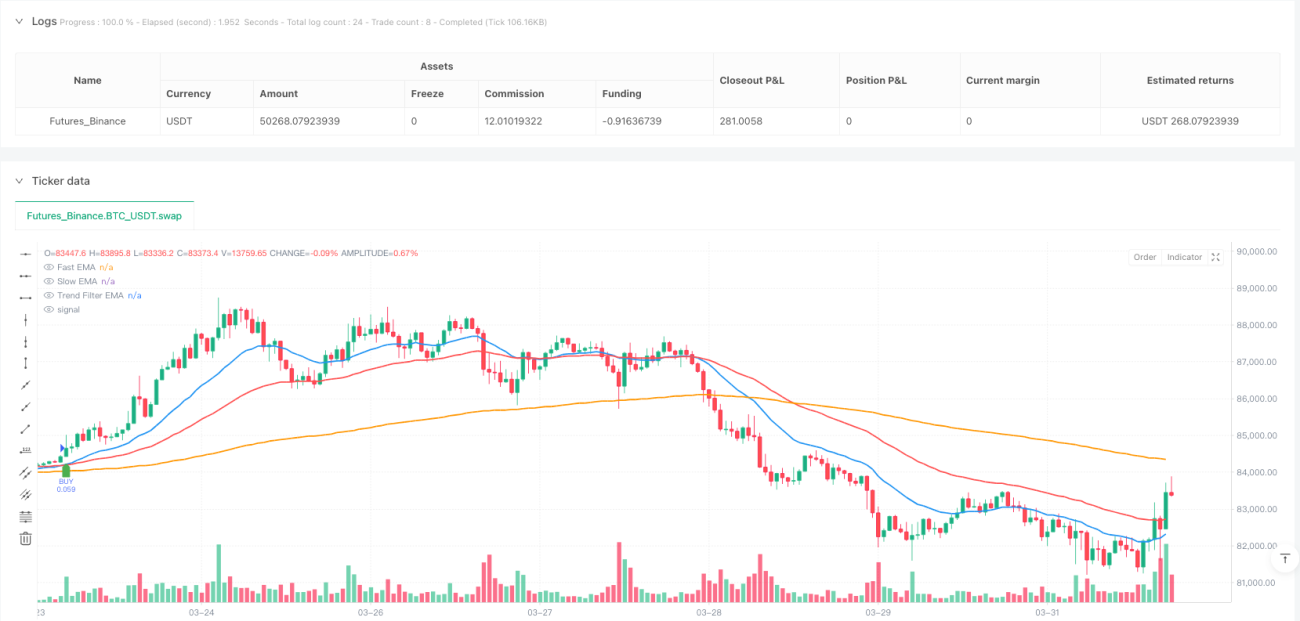
Trend Identification: The strategy employs three different period EMAs—a fast EMA (20-period), a slow EMA (50-period), and a trend filter EMA (200-period). The crossover of the fast and slow lines provides the primary entry signal, while the 200-period EMA determines the overall market trend direction.
-
Momentum Confirmation: To avoid false signals, the strategy incorporates RSI and MACD indicators for secondary confirmation. In an uptrend, buy signals are only considered when the RSI is above 55 and the MACD line is above the signal line; in a downtrend, sell signals are considered when the RSI is below 45 and the MACD line is below the signal line.
-
Risk Management: The strategy adopts an ATR-based dynamic stop-loss mechanism, setting the stop-loss point by multiplying the current ATR value by a user-defined multiplier (default 1.5), ensuring that the stop-loss position adapts to current market volatility.
-
Risk-Reward Ratio: The system allows users to set their desired risk-reward ratio (default 1:2), automatically calculating profit targets based on the stop-loss distance.
The strategy executes trades based on clear conditional logic: a buy signal is triggered when the fast EMA crosses above the slow EMA, the RSI is above 55, the MACD line crosses above the signal line, and the price is above the 200-period EMA. The opposite combination of conditions triggers a sell signal. Each entry is accompanied by an ATR-based stop-loss and corresponding profit target.
Strategy Advantages
-
Multiple Confirmation Mechanisms: By combining trend and momentum indicators, the strategy requires multiple technical conditions to be met simultaneously before executing a trade, greatly reducing false signals and improving trading accuracy.
-
Adapting to Market Volatility: By using ATR as the basis for stop-losses, the strategy can dynamically adjust stop-loss distances based on current market volatility, providing more room for stop-losses in highly volatile markets and tightening protection in less volatile ones.
-
Flexible Risk Control: Users can adjust the ATR multiplier and risk-reward ratio according to their risk preferences, implementing personalized risk management strategies suitable for different trading styles.
-
Trend Filtering: Using the 200-period EMA as an overall trend indicator ensures that the strategy only opens positions in clearly defined trend directions, avoiding frequent trading in range-bound markets.
-
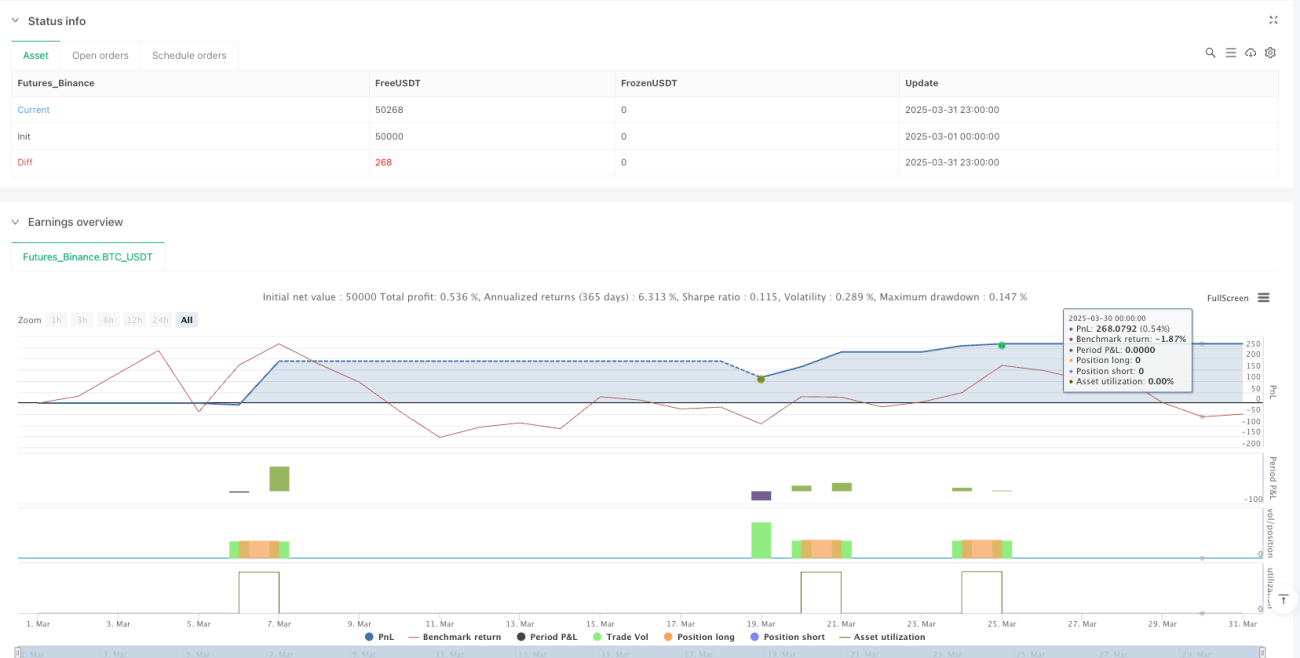
Visualization of Trading Results: The strategy includes built-in backtest result display functionality, allowing real-time viewing of trade counts, win/loss records, and overall profitability, facilitating strategy evaluation and optimization.
Strategy Risks
-
Lag Risk: All strategies based on moving averages have a certain amount of lag, which may lead to less than ideal entry points, especially in rapidly reversing markets. The solution is to consider adjusting EMA parameters or adding price action analysis to optimize entry timing.
-
False Breakout Risk: Despite using multiple confirmation mechanisms, the market may still experience false breakouts, triggering stop-losses. Consider adding volume confirmation or using volatility filters to reduce this type of risk.
-
Parameter Sensitivity: Strategy performance is sensitive to parameter settings, especially the choice of EMA periods and ATR multiplier. It's advisable to conduct extensive backtesting in different market environments to find the most stable parameter combinations.
-
Trend Reversal Risk: In strong trend reversal situations, the strategy may not adapt quickly enough, leading to significant drawdowns. Consider adding trend strength indicators or volatility change detection to identify potential reversal signals in advance.
-
Overtrading Risk: In range-bound markets, EMA crossovers may occur frequently, potentially leading to overtrading even with RSI and MACD filtering. Consider adding trading frequency limitations or range-bound market identification functions to avoid such situations.
Strategy Optimization Directions
-
Add Volume Confirmation: The current strategy makes decisions based solely on price-derived indicators, lacking confirmation from the volume dimension. Consider adding volume indicators such as On-Balance Volume (OBV) or Volume-Weighted Moving Average (VWMA) to enhance signal reliability, as healthy trends are typically supported by corresponding volume.
-
Optimize Trend Identification Mechanism: Consider adding adaptive moving averages or introducing trend strength indicators such as Average Directional Index (ADX) to more accurately identify trend strength and direction, avoiding frequent trading in weak trend or range-bound markets.
-
Introduce Market State Classification: Develop a market state recognition algorithm to classify the market into different states such as trending, ranging, and high volatility, and use differentiated parameter settings or trading strategies for different states to improve the strategy's adaptability.
-
Optimize Take Profit Strategy: The current strategy uses a fixed risk-reward ratio to set take profit points. Consider introducing trailing stops or dynamic take profit based on support/resistance levels to capture more profit in strong trends.
-
Optimize Entry Timing: Consider adding price pullback confirmation or waiting for hourly-level confirmation after EMA crossover signals to obtain better entry prices and reduce the risk of immediate reversal.
-
Add Timeframe Confirmation: Implement multi-timeframe analysis, requiring the trend direction of larger timeframes to be consistent with the trading direction, increasing the probability of successful trades.
Summary
The Dynamic Multi-Indicator Trend-Momentum Enhanced Trading Strategy forms a relatively complete trading system by integrating trend following, momentum confirmation, and dynamic risk management. The strategy uses EMA crossovers as the primary entry signal, RSI and MACD as momentum confirmation, and ATR-based stop-losses with an adjustable risk-reward ratio to manage the risk of each trade.
This strategy performs well in clearly trending markets but may face challenges in range-bound or highly volatile market environments. By adding volume confirmation, optimizing trend identification, introducing market state classification, improving take profit strategies, and implementing multi-timeframe analysis, the strategy's adaptability and stability can be further enhanced.
Ultimately, this strategy, which combines multiple technical indicators and risk management techniques, provides traders with a reliable framework that not only captures market trends but also effectively controls the risk of each trade, making it suitable for medium to long-term trend following trading.
/*backtest
start: 2025-03-01 00:00:00
end: 2025-03-31 23:59:59
period: 1h
basePeriod: 1h
exchanges: [{"eid":"Futures_Binance","currency":"BTC_USDT"}]
*/

//@version=5
strategy("High-Win Trend & Momentum Strategy", overlay=true, default_qty_type=strategy.percent_of_equity, default_qty_value=10)

// === INPUT PARAMETERS ===- 1