
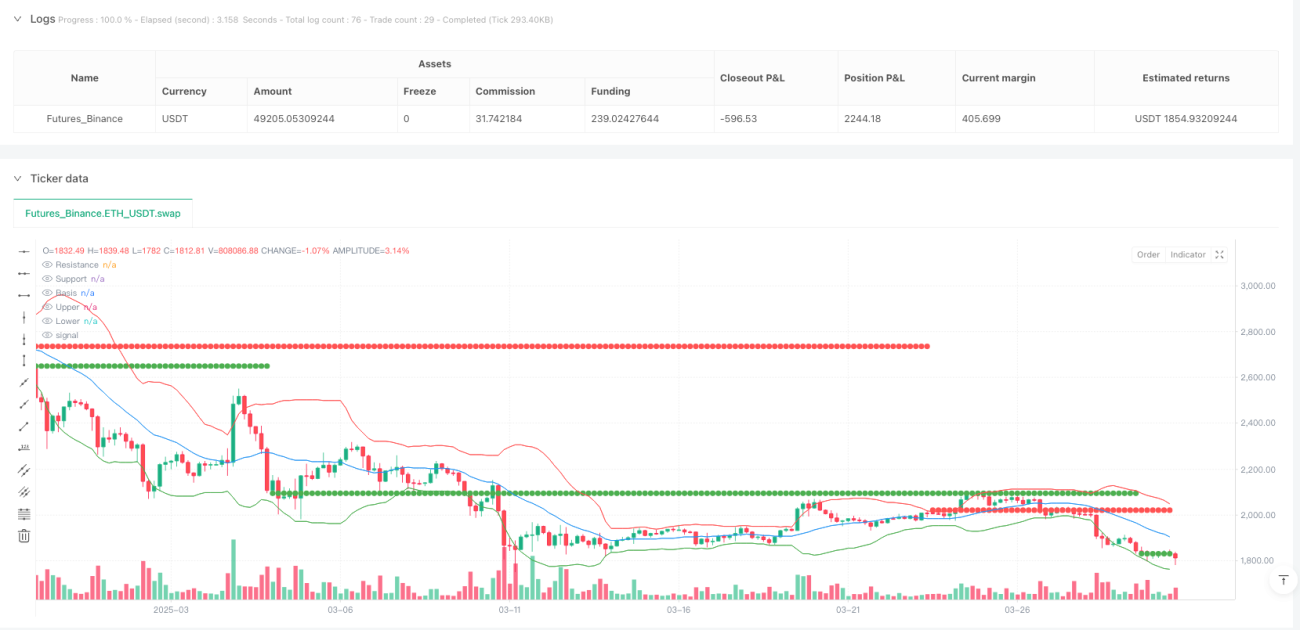
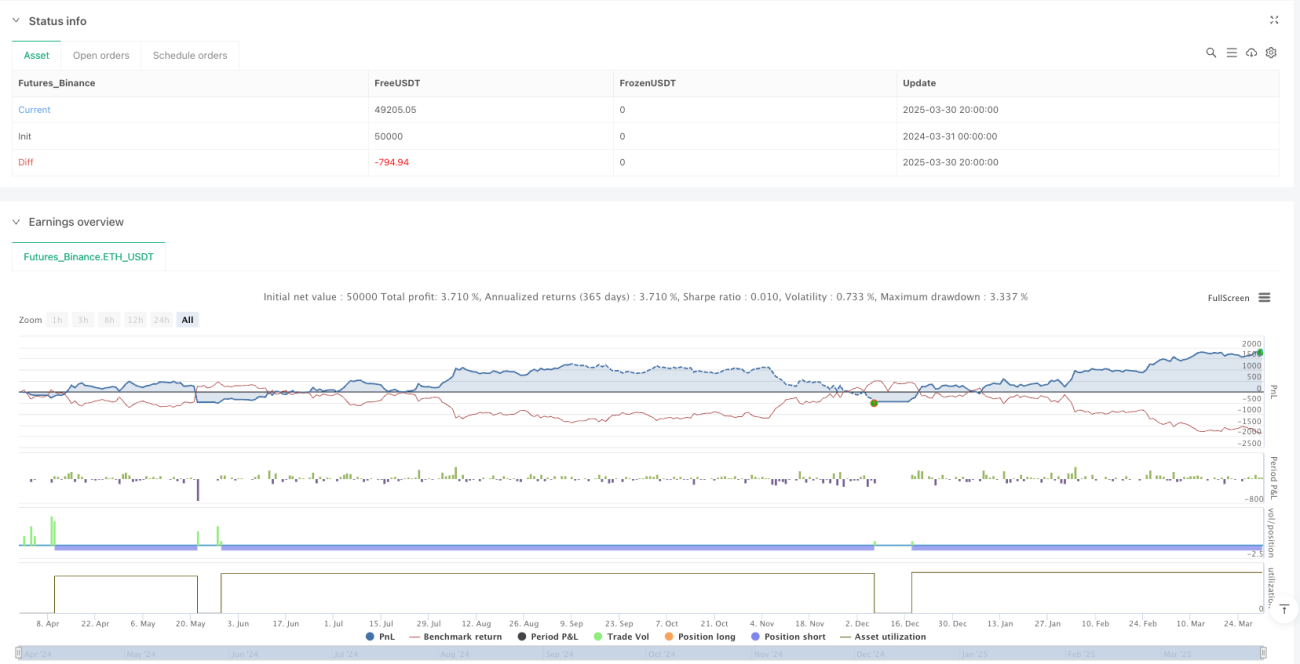
Overview
The Multi-Layer Bollinger Bands Support Resistance Price Breakout Trading Strategy is a quantitative trading system that combines technical indicators with price action theory. This strategy primarily relies on the collaborative effect of Bollinger Bands indicators and support/resistance levels to generate trading signals when prices break through specific zones. The system identifies important support and resistance levels and integrates them with the statistical volatility range of Bollinger Bands to execute trades when prices reach overbought or oversold areas while simultaneously violating key price levels. The strategy also incorporates risk management mechanisms through preset stop-loss levels and profit targets based on risk ratios, ensuring each trade has a clear risk-reward profile.
Strategy Principles
The core principles of this strategy are based on several key components:
-
Bollinger Bands Configuration: The system uses a 20-period Simple Moving Average (SMA) as the middle band of the Bollinger Bands, with a standard deviation multiplier of 2.0 to calculate the upper and lower bands. This configuration encompasses approximately 95% of price movements, making breakouts beyond the bands statistically significant.
-
Support/Resistance Identification: The strategy identifies potential resistance and support levels using historical data of highest and lowest prices within a 5-period range. When prices fluctuate near these key levels (±0.05%), the system records them as valid support or resistance levels.
-
Precise Entry Condition Definitions:
- Long Entry: The system generates a buy signal when the price falls below the lower Bollinger Band and simultaneously drops below the valid support level by a certain distance (25 pips).
- Short Entry: The system generates a sell signal when the price rises above the upper Bollinger Band and simultaneously exceeds the valid resistance level by a certain distance (25 pips).
-
Refined Risk Management:
- Stop-Loss Setting: The system sets a 15-pip stop-loss distance for each trade.
- Take-Profit Setting: The profit target is set at twice the stop-loss distance, ensuring a 1:2 risk-reward ratio.
-
Zero Position Condition: The strategy is designed to avoid overlapping trades, only considering new entry signals when there is currently no open position.
Strategy Advantages
-
Multiple Confirmation Mechanism: The strategy combines technical indicators (Bollinger Bands) with price structure (support/resistance levels) for dual confirmation, significantly reducing false signals. Trading signals are only generated when prices simultaneously meet both conditions, improving trading accuracy.
-
Statistical Foundation: Bollinger Bands are based on statistical principles, with the upper and lower bands representing price volatility ranges. When prices break through these boundaries, it often indicates statistically abnormal market movements, providing a mathematical basis for trading.
-
Clear Risk Control: Each trade has preset stop-loss and take-profit levels, with a fixed risk-reward ratio of 1:2, making long-term trading results more predictable and consistent.
-
Adaptive Design: Support and resistance levels are dynamically calculated based on recent price action rather than statically set, allowing the strategy to adapt to price structure changes under different market conditions.
-
Visualized Trading Signals: The strategy plots buy/sell arrows and changes candle colors, allowing traders to visually identify trading signals, facilitating real-time monitoring and backtesting analysis.
Strategy Risks
-
False Breakout Risk: Prices may temporarily break through support/resistance levels or Bollinger Band boundaries before quickly reverting, leading to erroneous signals. Solutions may include introducing confirmation periods, requiring prices to maintain breakout status for a specific time.
-
Poor Performance in Ranging Markets: In narrow-range fluctuating markets, Bollinger Bands contract and support/resistance levels are also closer, potentially leading to excessive trading signals and losses. This can be addressed by adding a Bollinger Band width filter to pause trading when the band width falls below a specific threshold.
-
High Volatility Risk: During major news events or extreme market conditions, prices may fluctuate dramatically and exceed preset stop-loss levels, causing actual losses to exceed expectations. It is advisable to pause trading during known high-volatility periods (such as before important economic data releases) or increase stop-loss distances.
-
Parameter Sensitivity: Strategy performance is highly dependent on parameter settings, including Bollinger Band length, standard deviation multiplier, support/resistance distance, etc. Different market environments may require different parameter settings, and excessive optimization may lead to curve-fitting issues.
-
Low Liquidity Risk: During low-volume trading sessions, actual execution prices may differ significantly from the prices at signal generation, leading to increased slippage. It is recommended to limit operations to major trading sessions and set maximum acceptable slippage values.
Strategy Optimization Directions
-
Dynamic Parameter Adjustment Mechanism: An adaptive parameter system based on market volatility can be introduced. For example, automatically increasing the Bollinger Band standard deviation multiplier during high-volatility periods, or dynamically adjusting stop-loss distances based on ATR (Average True Range). This allows the strategy to better adapt to different market states.
-
Time Filter: Introduce trading time window filters to avoid low liquidity sessions and known high-volatility event periods. This can be implemented by adding time-based conditional judgments in the strategy code, effectively reducing false signals caused by abnormal market volatility.
-
Trend Filter: Add longer-period trend determination indicators, such as 50 or 200-period moving averages, to only trade in the direction of the overall trend. For example, only considering long signals when prices are above the long-term moving average, and vice versa. This can improve the win rate and profit factor of trades.
-
Volume Confirmation: Add a volume analysis component, requiring significant volume increases to accompany price breakouts to confirm their validity. This can be achieved by comparing the current trading volume with the relative relationship to recent average trading volumes.
-
Dynamic Take-Profit Mechanism: Introduce trailing stop functionality to lock in partial profits as profitable trades continue to develop. Moving stops can be set based on ATR or percentage of price movements, allowing the strategy to capture more profits in strong trending markets.
Summary
The Multi-Layer Bollinger Bands Support Resistance Price Breakout Trading Strategy is a quantitative trading system that combines statistical principles with technical analysis. It generates trading signals when prices break through key levels through the collaborative action of Bollinger Bands indicators and dynamic support/resistance levels. The built-in risk management mechanism ensures that the risk-reward ratio of trades remains at a reasonable level, while clear entry and exit rules reduce the interference of emotional factors on trading decisions.
This strategy is particularly suitable for use in market environments with obvious trends or range breakouts but may require cautious operation in low-volatility or highly uncertain markets. By implementing the suggested optimization measures, such as adding trend filters, dynamic parameter adjustments, and volume confirmation, the robustness and adaptability of the strategy can be further enhanced. Ultimately, the success of any trading strategy depends on strict risk control and continuous performance monitoring, which is particularly important when using this strategy.
- 1