
Overview
The Multi-Timeframe EMA-RSI-AO-PSAR Dynamic Stop-Loss and Take-Profit Strategy is a quantitative trading system that combines multiple technical indicators across different timeframes. This strategy primarily utilizes the Awesome Oscillator (AO), Exponential Moving Average (EMA), Relative Strength Index (RSI), and Parabolic SAR (PSAR) from various time periods to determine market trend direction and set dynamic stop-loss and take-profit levels. The strategy is designed with a 2:1 reward-to-risk ratio, meaning the take-profit level is twice the distance of the stop-loss, which contributes to long-term profitability.
Strategy Principles
The core principle of this strategy is to confirm trend direction through a combination of indicators across multiple timeframes, enter at the early stages of a trend, and use PSAR as a dynamic stop-loss point. Specifically:
-
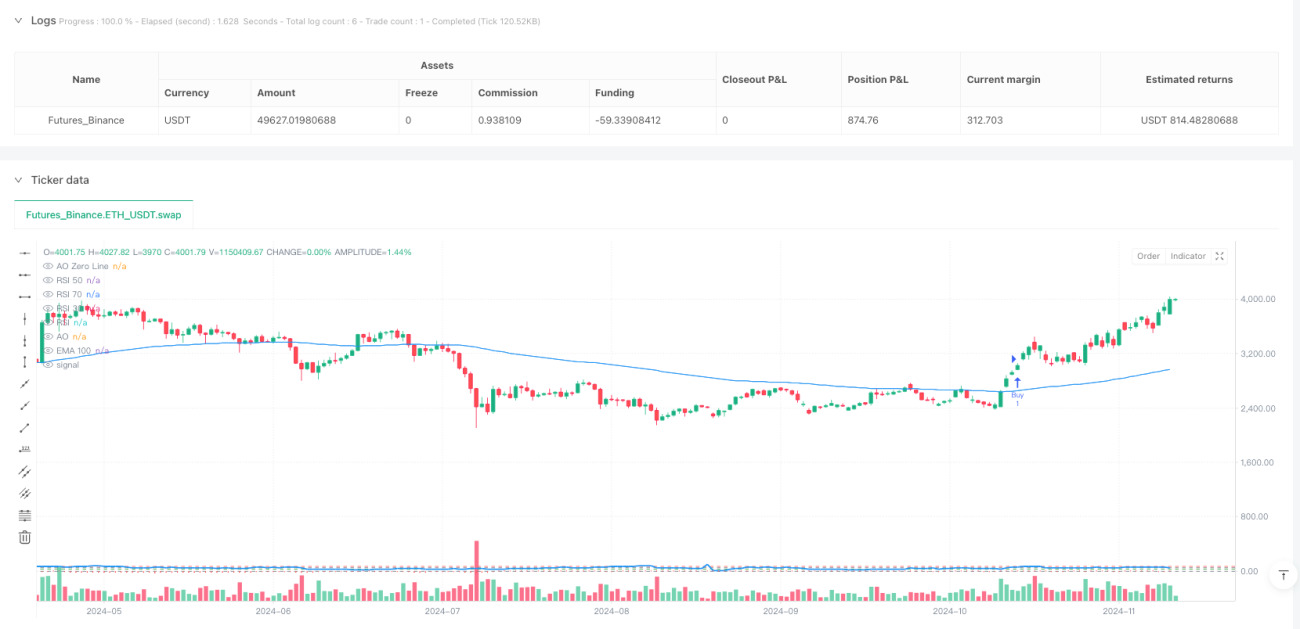
Multi-Timeframe Analysis: The strategy employs different time periods to observe various indicators, including 5-minute AO, 60-minute EMA, 15-minute RSI, and 60-minute PSAR. This multi-timeframe approach helps reduce false signals.
-
Buy Conditions:
- AO indicator crosses above the zero line on the previous candle (ta.crossover(ao[1], 0))
- Current AO value is greater than 0 (ao > 0)
- Price is above the 100-period EMA (close > ema100)
- RSI value is greater than or equal to 50 (rsi >= 50)
-
Sell Conditions:
- AO indicator crosses below the zero line on the previous candle (ta.crossunder(ao[1], 0))
- Current AO value is less than 0 (ao < 0)
- Price is below the 100-period EMA (close < ema100)
- RSI value is less than or equal to 50 (rsi <= 50)
-
Risk Management:
- Stop-loss is set at the PSAR indicator level (stopLossLevel = psar)
- Take-profit is set at twice the distance between entry price and stop-loss (takeProfitLevel = close + 2 * (close - stopLossLevel))
Strategy Advantages
-
Multiple Confirmation System: The strategy uses multiple indicators and data from different timeframes to confirm trading signals, reducing the false signal rate.
-
Trend Following Advantage: Through the combination of EMA and RSI, the strategy ensures trading only in clear trend directions, avoiding counter-trend operations.
-
Dynamic Stop-Loss Mechanism: Using PSAR as a dynamic stop-loss point, this method adapts better to market fluctuations than fixed stop-losses, giving price enough room to breathe while protecting profits.
-
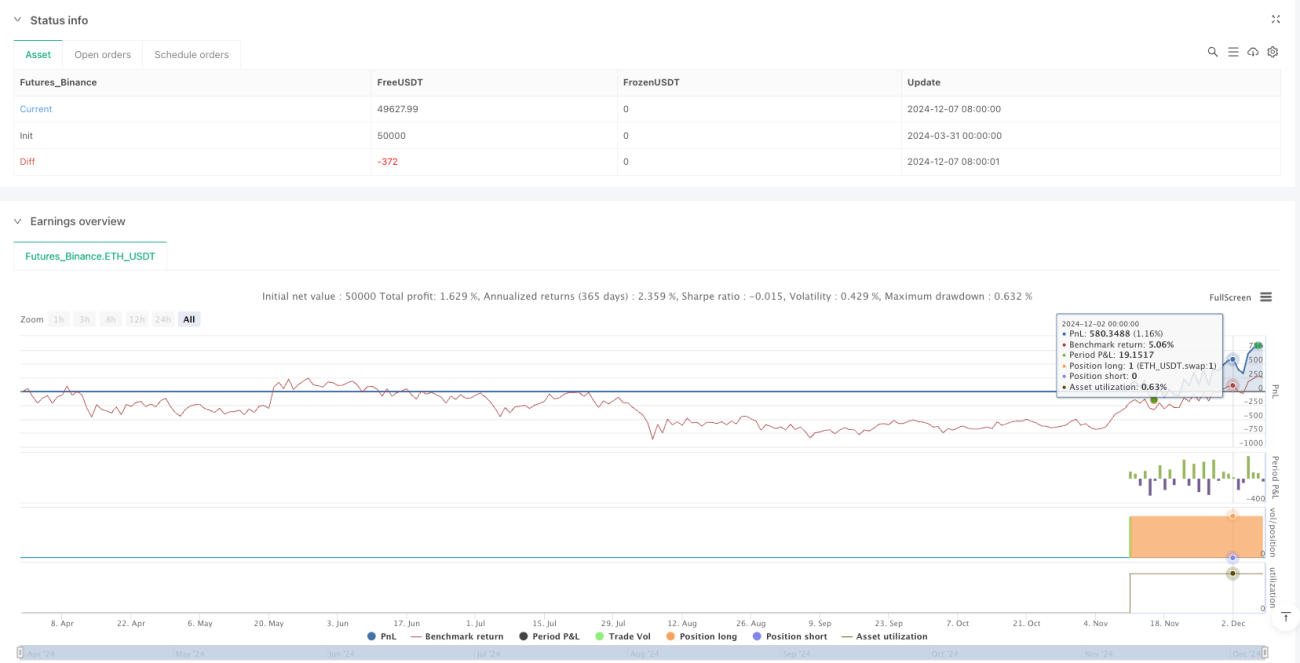
Optimized Risk-Reward Ratio: The 2:1 reward-to-risk ratio means the strategy can be profitable in the long term even with a win rate as low as 40%.
-
High Adaptability: Strategy parameters can be adjusted according to different market environments and trading instruments, increasing adaptability.
-
Clear Entry and Exit Rules: The strategy rules are explicit, reducing subjective judgment and helping maintain trading discipline.
Strategy Risks
-
Multi-Indicator Dependency Risk: When multiple indicators give inconsistent signals, the strategy may perform poorly, especially in ranging markets.
-
Time Lag Risk: Due to the use of lagging indicators like EMA, the strategy may miss some rapid market turning points, resulting in entries or exits later than the optimal timing.
-
Parameter Sensitivity: Strategy performance is highly dependent on selected parameters, and different market conditions may require different parameter settings. The current strategy uses fixed parameters such as 34-period AO and 100-period EMA, which may not be suitable for all market environments.
-
Gap Risk for Stop-Loss: In cases of significant market events or overnight gaps, the PSAR stop-loss may not execute effectively, and the actual stop-loss point may be far lower than expected.
-
Violent Volatility Risk: During extreme market volatility, the PSAR stop-loss may be quickly triggered, causing premature exits from potentially good trades.
Strategy Optimization Directions
-
Adaptive Parameter Settings: Introduce volatility indicators (such as ATR) to automatically adjust EMA periods, RSI thresholds, and PSAR parameters based on market volatility, making the strategy more adaptive.
-
Add Volume Confirmation: Add volume confirmation conditions when generating signals, such as requiring volume to increase synchronously when AO crosses above the zero line, which can improve signal quality.
-
Optimize Entry Timing: Add price pattern confirmation, such as waiting for a small pullback after AO crosses above the zero line before entering, improving entry price quality.
-
Dynamic Risk-Reward Ratio Adjustment: Dynamically adjust the risk-reward ratio based on market volatility or trend strength, using larger ratios (e.g., 3:1) in strong trends and more conservative ratios (e.g., 1.5:1) in weak trends.
-
Add Filters: Introduce market environment filters, such as the ADX indicator, to trade only when trends are clear (e.g., ADX > 25), avoiding false signals in ranging markets.
-
Optimize Fund Management: Introduce dynamic position sizing, adjusting the size of each trade based on signal strength, market volatility, and account equity changes.
Summary
The Multi-Timeframe EMA-RSI-AO-PSAR Dynamic Stop-Loss and Take-Profit Strategy is a quantitative trading system that comprehensively utilizes multiple technical indicators and multi-timeframe analysis. Through the synergistic effect of AO, EMA, RSI, and PSAR, this strategy can effectively identify market trends and set reasonable dynamic stop-loss and take-profit levels. The strategy's 2:1 reward-to-risk ratio design also provides a good foundation for long-term profitability.
However, the strategy also has risks such as multi-indicator dependency, time lag, and parameter sensitivity. Future optimization can be achieved through introducing adaptive parameters, volume confirmation, dynamic risk-reward ratios, and market environment filters. Ultimately, effective application of this strategy requires traders to understand its core principles, flexibly adjust parameters according to specific market environments, and always maintain strict risk management.
- 1