
Overview
The BTST High-Probability Breakout Strategy with Selective Stock Screening System is a quantitative approach designed for intraday and overnight trading, aimed at identifying and capturing short-term price momentum breakthrough opportunities. This strategy combines time-specific price movement screening, classic technical pattern confirmation, and dynamic resistance breakout analysis to construct a multi-layered trading decision system. The core of the strategy lies in precisely filtering targets with a 2-3% gain at 3 PM, further confirming bullish signals through candlestick pattern analysis, and setting reasonable entry and exit mechanisms to avoid overextension risks, thereby achieving high-probability short-term trading opportunities.
Strategy Principles
The operational principles of this strategy are based on multi-condition progressive filtering and confirmation:
-
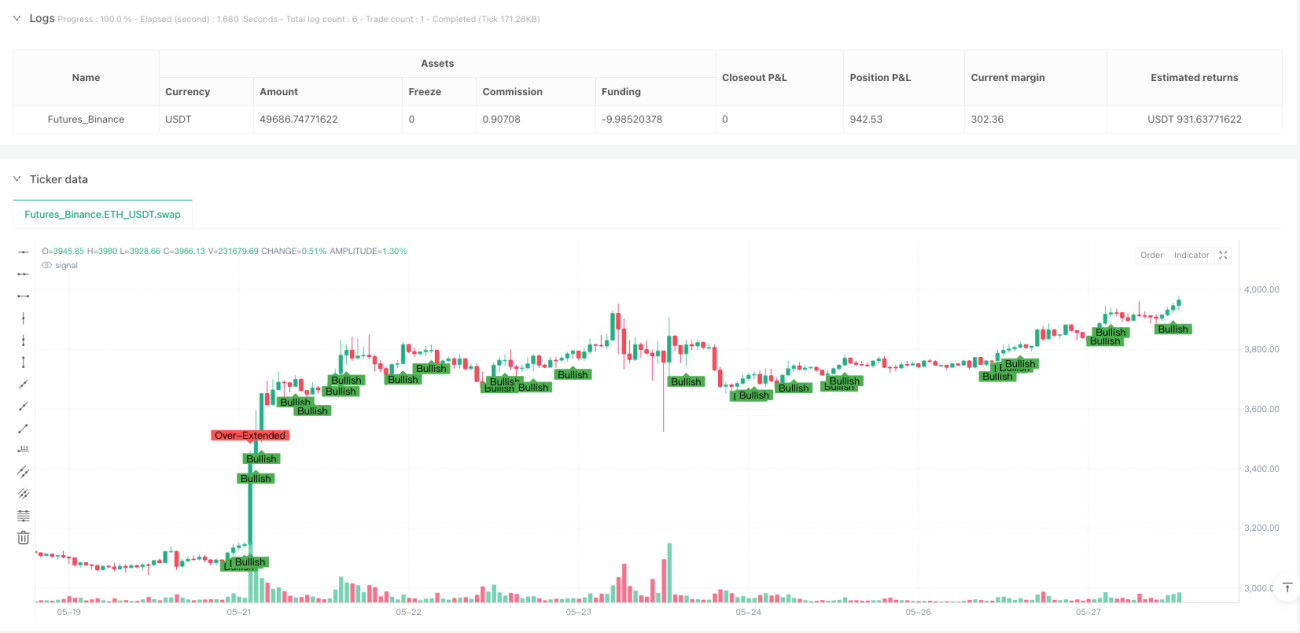
Initial Screening (3 PM): The strategy first screens for instruments with a daily gain of 2-3% at precisely 3 PM. This specific time window selection is based on the assumption that market momentum may continue to develop into the close.
-
Daily Candlestick Pattern Analysis: The strategy incorporates three classic bullish pattern assessments:
- Bullish Engulfing Pattern: When the current day's candlestick completely engulfs the previous day's candlestick, and the current day's closing price is higher than its opening price.
- Morning Star Pattern: Composed of three candlesticks, showing a transition from bearish to bullish sentiment.
- Three White Soldiers Pattern: Three consecutive positive candlesticks with each closing price higher than the previous candlestick's closing price.
-
30-Minute Resistance Breakout: The strategy dynamically sets resistance levels every 30 minutes (the highest point of the current 30-minute period) and determines whether the price breaks through this resistance level, serving as a potential signal for continued upward movement or profit-taking.
-
Avoiding Overextension: The strategy calculates intraday gains to avoid instruments that have already risen more than 5% or fallen more than 10%, mitigating potential pullback risks.
-
Next-Day Watchlist: Combining the above conditions, instruments that meet the initial screening, bullish pattern confirmation, and are not overextended are added to the next-day watchlist.
-
Exit Strategy: Simulating pre-market and opening observations, if an instrument gaps up by more than 2% and the price remains above the previous day's low, positions are maintained for at least 15 minutes, awaiting potential further upside.
-
Buy and Sell Triggers: Buy signals are based on a combination of bullish patterns, initial screening conditions, and non-overextension assessment; sell signals rely on resistance level breakout conditions and non-overextension status.
Strategy Advantages
-
Temporal Precision: The strategy screens at the specific time point of 3 PM, effectively capturing a critical stage of intraday momentum development, providing early warning for potential continuation moves the next day.
-
Multiple Confirmation Mechanism: By combining percentage price changes, technical patterns, and resistance breakouts as triple confirmation, the strategy significantly enhances signal reliability and reduces false signal risks.
-
Integrated Risk Management: The strategy incorporates filtering conditions to avoid overextended stocks, effectively mitigating chase-the-high risks and improving the safety margin of trades.
-
Flexible Exit Mechanism: The strategy sets flexible exit conditions based on resistance breakouts and price performance, facilitating timely position closure when profits are realized or risks materialize.
-
Visual Assistance: The strategy marks various conditions and signals on charts, allowing traders to intuitively understand market status and strategy logic, facilitating real-time decision adjustments.
-
Alert System Integration: Built-in alert condition settings enable traders to receive timely buy and sell signal notifications without constant screen monitoring, improving trading efficiency.
Strategy Risks
-
False Breakout Risk: The 30-minute resistance breakout may exhibit false breakout phenomena, especially during high market volatility, potentially leading to unnecessary trading signals. The solution is to add volume confirmation or set higher breakout thresholds.
-
Pattern Recognition Limitations: Candlestick pattern recognition based on fixed rules may not capture all effective formations in complex market environments. Consider cross-validation with other technical indicators such as RSI or MACD.
-
Time Dependency: The strategy heavily relies on the 3 PM screening condition; missing this time point or experiencing data delays may lead to missed trading opportunities. Consider expanding the screening time window or setting alternative time points.
-
Over-Filtering Risk: The layering of multiple conditions may result in too few qualifying trading opportunities, affecting the strategy's practicality. Consider appropriately relaxing certain screening conditions or dynamically adjusting parameters based on market conditions.
-
Market State Adaptability: This strategy performs better in specific market conditions (such as moderate uptrends) but may underperform in range-bound or highly volatile markets. Recommend selectively employing the strategy based on the overall market environment.
Strategy Optimization Directions
-
Dynamic Parameter Adjustment: The current strategy uses fixed percentage thresholds (2-3% gain screening, 5-10% overextension judgment). Consider dynamically adjusting these parameters based on market volatility to improve the strategy's adaptability across different market environments.
-
Volume Confirmation Addition: The strategy currently relies primarily on price action. Consider adding volume analysis dimensions, such as requiring breakouts to occur on increased volume, or setting conditions where volume increases by a specific percentage compared to previous average levels, improving signal quality.
-
Timeframe Expansion: Consider performing pattern and breakout confirmations across different timeframes (such as 15-minute, 60-minute), constructing a multi-timeframe confirmation system to reduce false signals and enhance signal reliability.
-
Trend Filter Integration: Introduce medium-term trend assessment indicators, such as moving average systems or the ADX indicator, to ensure short-term trading direction aligns with medium-term trends, avoiding counter-trend operations and improving success rates.
-
Machine Learning Optimization: Utilize machine learning algorithms to recognize patterns and optimize parameters from successful historical cases, extracting more refined trading rules and dynamic threshold adjustment mechanisms.
-
Drawdown Control Mechanism: Add stop-loss settings based on fixed percentages or ATR multiples, and consider implementing partial profit-taking mechanisms, such as scaled exits or trailing stops, to better control risk and lock in profits.
Conclusion
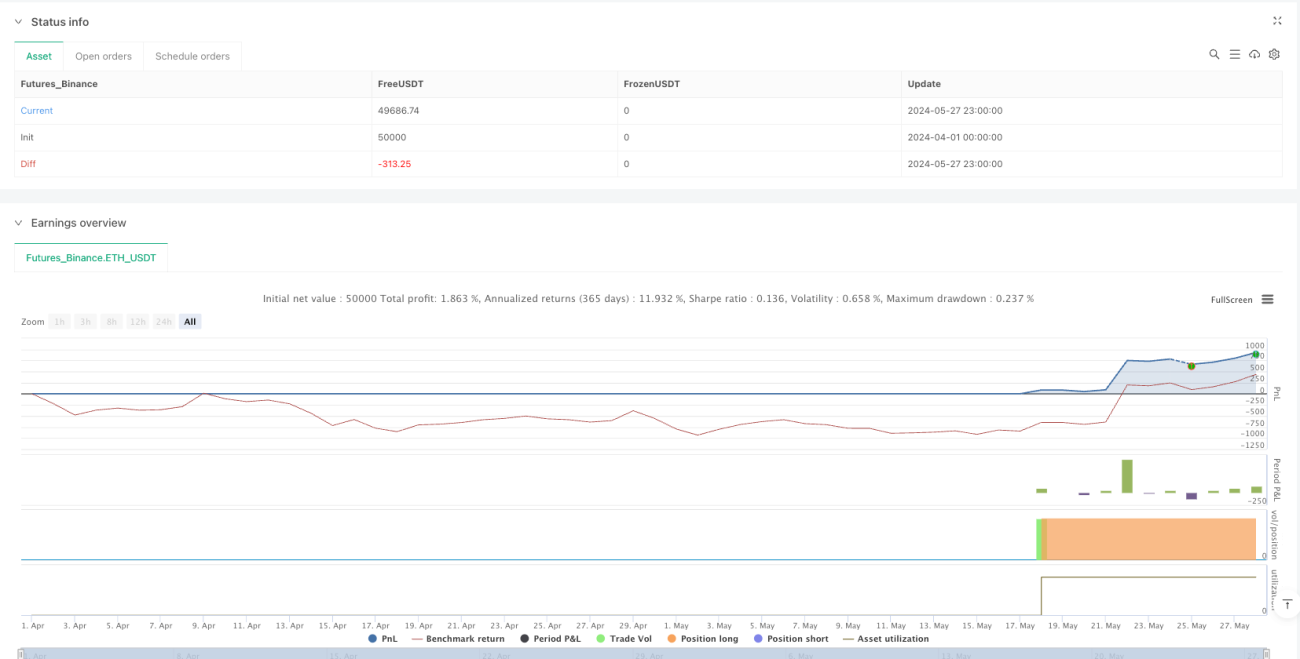
The BTST High-Probability Breakout Strategy with Selective Stock Screening System constructs a systematic short-term trading decision framework by combining time-specific screening, technical pattern analysis, and dynamic resistance breakout assessment. This strategy is particularly suitable for finding instruments that have accumulated certain momentum during the day and have technical confirmations, capturing potential continuation moves the next day. Although the strategy considers multiple confirmations and risk controls in its design, it still requires flexible adjustments and continuous optimization based on actual market conditions. By implementing the suggested optimization directions, especially dynamic parameter adjustments, volume confirmation, and multi-timeframe analysis, the strategy's robustness and adaptability can be further enhanced, providing traders with a more reliable decision support tool.
- 1