
Strategy Overview
This strategy is a trend-following trading system based on the Donchian Channel and Average True Range (ATR). It utilizes the deviation between the middle band of the Donchian Channel calculated on 4-hour candles and the current price, combined with ATR as a dynamic volatility measurement indicator, to identify entry and exit opportunities in market fluctuations. The strategy employs a gradient position building and stop-loss mechanism, managing positions through fixed trading amounts (5.1 USDT) to achieve effective capital utilization during high volatility market conditions.
Strategy Principles
The core logic of the strategy is based on the following key elements:
- Multi-timeframe Analysis Framework: The strategy executes trades on 1-minute candles but calculates technical indicators using 4-hour candle (240-minute) data, leveraging the advantages of multi-timeframe analysis.
- Donchian Channel Calculation: Based on 20 periods of 4-hour candle data, it calculates the upper band (highest price), lower band (lowest price), and middle band (simple moving average of closing prices).
- Dynamic Interval Determination: Uses twice the ATR value as a dynamic trading interval, allowing the strategy to self-adapt to changes in market volatility.
- Trade Execution Logic:
- Initial state (no position): Executes first purchase when the Donchian middle band minus the current price exceeds the set interval.
- Position state: Adds or reduces positions when the difference between the base price and current price exceeds the interval.
- Position management: Fixed amount (5.1 USDT) per trade, calculating the trading quantity based on the current price.
- Closing mechanism: Executes selling when the price rises above the interval; if the position is insufficient, sells all available positions.
Strategy Advantages
- Multi-timeframe Analysis Benefits: By executing trades on shorter timeframes (1-minute candles) but making decisions based on longer timeframe (4-hour candles) technical indicators, it reduces interference from short-term market noise while maintaining the ability to track medium to long-term trends.
- Dynamic Adaptation to Market Volatility: Using ATR as a volatility measure, the strategy can automatically adjust trading intervals according to changes in market volatility, setting larger intervals in high-volatility markets and smaller intervals in low-volatility markets.
- Gradient Position Building Mechanism: When prices continue to fall, the strategy adds positions at each interval point, averaging entry costs and reducing risk exposure from single trades.
- Fixed Amount Trading: Each trade uses a fixed amount rather than a fixed quantity, which better aligns with risk management principles, avoiding excessive investment at high price points or insufficient investment at low price points.
- Comprehensive Logging: The strategy implements detailed trade logging and visual labeling, including trade type, price, interval, quantity, and total position information, facilitating backtesting analysis and strategy optimization.
Strategy Risks
- Trend Reversal Risk: During strong trend reversals, the strategy may fail to identify market turns in a timely manner, leading to significant losses after consecutive position additions. Solution: Introduce trend confirmation indicators or set limits on maximum position additions.
- Capital Depletion Risk: In continuous one-way markets, multiple fixed-amount additions may lead to rapid or excessive capital concentration. Solution: Set total capital usage ratio limits or dynamically adjust single trade amounts.
- Parameter Sensitivity: The choice of ATR multiplier (2x) and Donchian Channel period (20) significantly impacts strategy performance; improper parameter settings may lead to excessive or insufficient signals. Solution: Find optimal parameter combinations through historical backtesting or implement parameter adaptive mechanisms.
- Liquidity Risk: In low-liquidity markets, market orders may result in significant slippage, affecting the actual execution of the strategy. Solution: Consider using limit orders or adding liquidity filtering conditions.
- Commission Cost Accumulation: The strategy may trade frequently, generating substantial transaction costs (set at 0.1%), potentially eroding profits over time. Solution: Optimize trading frequency or consider exchanges with lower commissions.
Strategy Optimization Directions
- Add Market Environment Filtering: Combine volatility indicators (such as Bollinger Band width or relative ATR values) to determine the current market environment and adjust strategy parameters or pause trading in different market states. This helps avoid cost losses from frequent trading in low-volatility or oscillating markets.
- Dynamic Adjustment of ATR Multiplier: Dynamically adjust the ATR multiplier based on historical volatility or market trend strength, using smaller multipliers in strong trend markets to track prices more closely and larger multipliers in oscillating markets to reduce false signals.
- Introduce Stop-Loss Mechanisms: Set maximum loss limits or trailing stops to prevent excessive losses on single trades. Especially after multiple position additions, consider setting comprehensive stop-loss levels to protect capital.
- Optimize Position Management: Consider using decreasing or increasing trade amounts rather than fixed amounts, dynamically adjusting the capital proportion of each trade based on the size of existing positions or market volatility.
- Add Trading Time Filters: Analyze performance across different trading sessions to avoid inefficient or high-risk periods, such as crossover times between Asian, European, and American trading sessions or before/after major economic data releases.
- Integrate Other Confirmation Indicators: Combine with indicators such as RSI, MACD for auxiliary confirmation to improve signal quality and reduce false entries.
- Adaptive Donchian Channel Period: Dynamically adjust the calculation period of the Donchian Channel based on market conditions, using shorter periods in high-volatility markets to improve response speed and longer periods in low-volatility markets to reduce noise.
Conclusion
The Multi-Timeframe Donchian Channel and ATR Dynamic Interval Volatility Following Trading Strategy is a quantitative trading system that combines technical analysis and risk management. By utilizing 4-hour period data to execute decisions on 1-minute candles, the strategy achieves effective tracking of medium-term trends while using ATR to dynamically adjust trading intervals to adapt to different market environments. Fixed amount trading and gradient position building mechanisms help with risk control and cost averaging.
This strategy is particularly suitable for high-volatility market environments but requires attention to trend reversal risks and capital management issues. Through optimization measures such as adding market environment filtering, dynamic parameter adjustments, and stop-loss mechanisms, the strategy's robustness and long-term profitability can be further improved. In practical applications, it is recommended to conduct thorough backtesting, optimize parameters for specific trading instruments, and implement strict risk control measures to ensure capital safety.
/*backtest
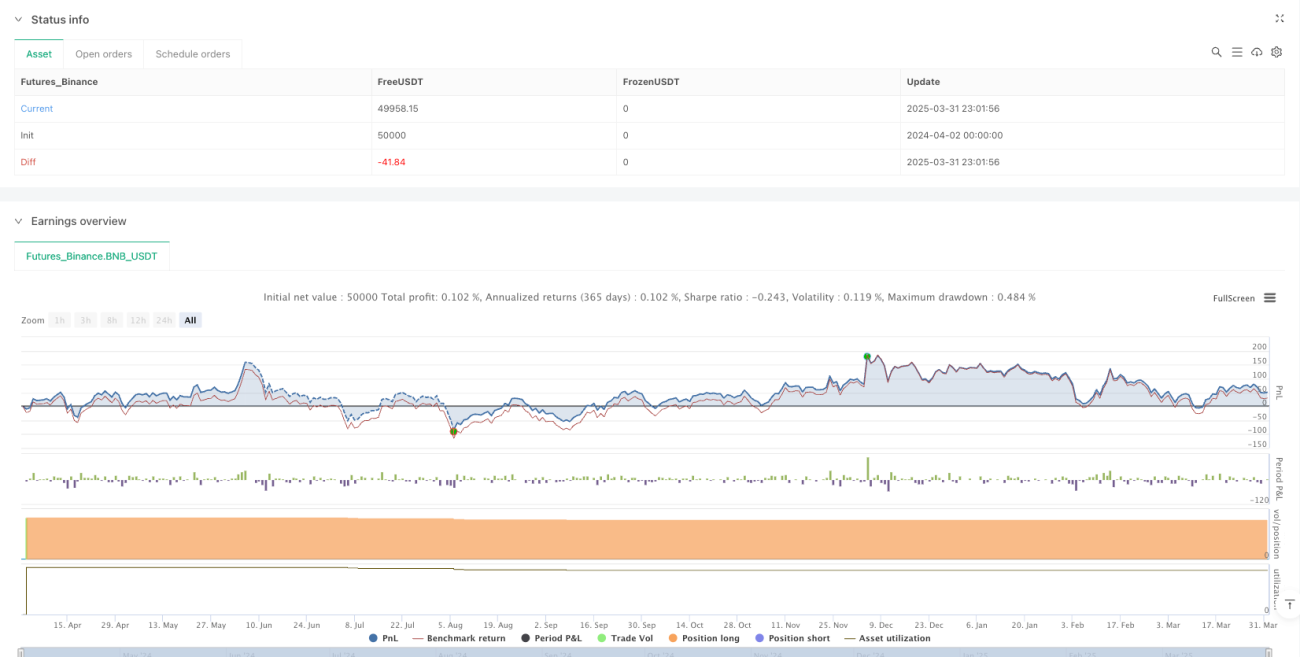
start: 2024-04-02 00:00:00
end: 2025-04-01 00:00:00
period: 1h
basePeriod: 1h
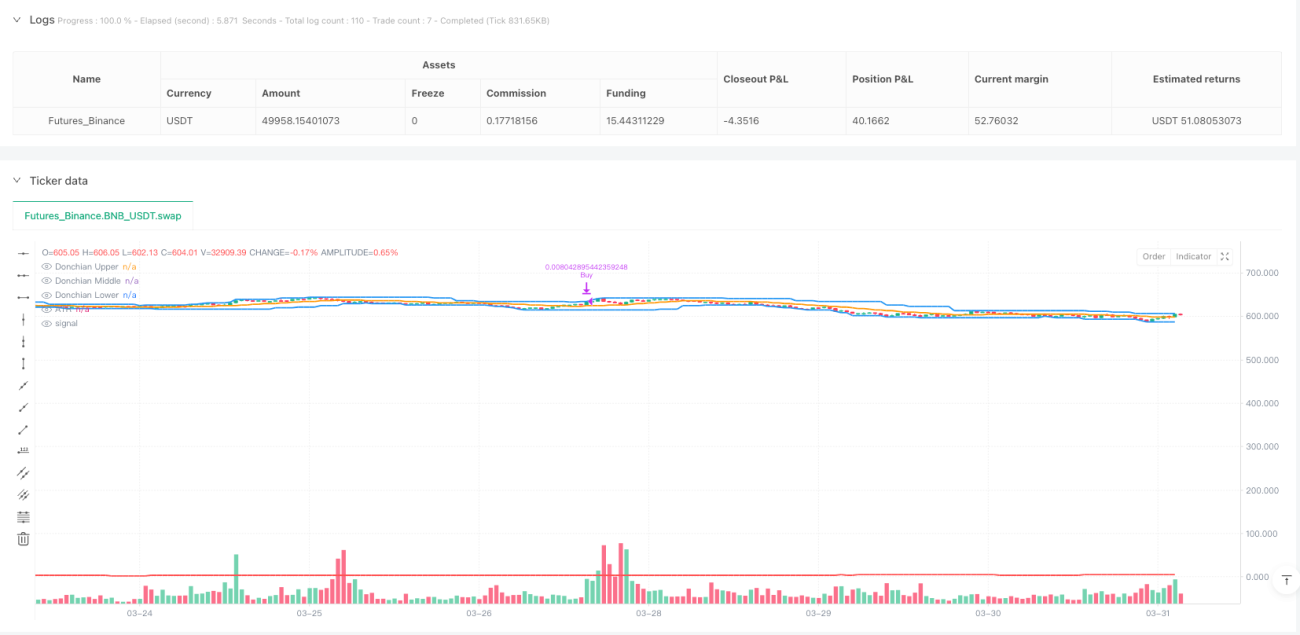
exchanges: [{"eid":"Futures_Binance","currency":"BNB_USDT"}]
*/
//@version=5
strategy("Donchian Channel and ATR Strategy", overlay=true, currency="USDT", commission_type=strategy.commission.percent, commission_value=0.1)
// 用pine编写策略,实时执行。- 1