
Overview
The Multi-EMA Crossover Momentum Strategy with Risk-Reward Optimization is a quantitative trading system based on technical analysis, with its core logic built on crossover signals between the 50-day and 200-day Exponential Moving Averages (EMA). This strategy utilizes the classic Golden Cross and Death Cross technical indicators as primary trading signals, combined with preset Stop-Loss and Take-Profit mechanisms to form a comprehensive risk management system. The core objective of the strategy design is to capture medium to long-term trend changes while optimizing trading outcomes through precise risk-reward ratio settings.
Strategy Principles
The operating principle of this strategy is based on two main technical analysis concepts:
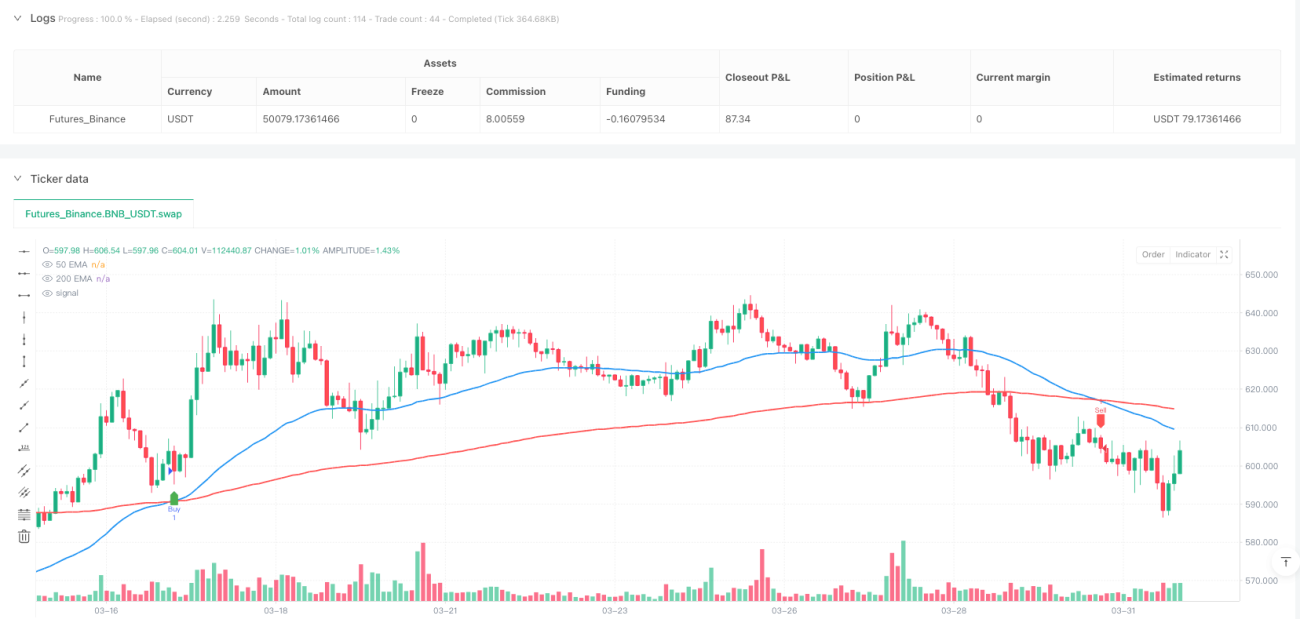
- Golden Cross Signal: When the short-term 50-day EMA crosses above the long-term 200-day EMA, the system generates a buy signal and enters a long position. This signal is typically viewed as confirmation that the market is turning to an upward trend.
- Death Cross Signal: When the short-term 50-day EMA crosses below the long-term 200-day EMA, the system generates a sell signal and enters a short position. This signal is typically viewed as confirmation that the market is turning to a downward trend.
Crucially, the strategy not only relies on EMA crossovers for entry but also implements a robust stop-loss and take-profit mechanism:
- Long position stop-loss set at 1% below the entry price
- Long position take-profit set at 2x the risk (based on the default 1:2 risk-reward ratio)
- Short position stop-loss set at 1% above the entry price
- Short position take-profit set at 2x the risk
This risk management mechanism ensures that even in the case of false signals, losses are strictly controlled within a predictable range, while in the case of correct signals, profit targets have sufficient room for realization.
Strategy Advantages
After in-depth analysis, the strategy demonstrates the following significant advantages:
-
Trend Capture Capability: By combining long and short-term moving averages, the strategy can effectively identify key trend change points in the market, avoiding false signals caused by short-term fluctuations.
-
Automated Risk Management: The strategy incorporates comprehensive stop-loss and take-profit mechanisms, ensuring that each trade has clear risk boundaries and profit targets, reducing emotional interference from manual decision-making.
-
Customizable Risk-Reward Ratio: The strategy allows traders to adjust the risk-reward ratio according to their risk preferences, with the default setting at 1:2, which can be optimized for different market environments.
-
Clear Entry and Exit Conditions: The strategy rules are explicit with no gray areas, which helps maintain trading discipline and avoid impulsive trading.
-
Adaptability to Different Market Environments: The EMA crossover strategy performs excellently in trending markets, while the stop-loss settings also provide protection in range-bound markets.
-
Technical Indicator Visualization: The strategy integrates graphical displays of moving averages and signals, helping traders intuitively understand market conditions and strategy logic.
Strategy Risks
Despite its many advantages, the strategy also has some potential risks that need attention:
-
Frequent Trading in Range-Bound Markets: During consolidation phases, the 50-day and 200-day EMAs may cross frequently, leading to excessive trading signals and a "whipsaw effect," increasing transaction costs and potentially resulting in consecutive small losses.
- Solution: Consider adding additional filtering conditions, such as requiring the crossover to maintain a certain duration or magnitude before confirming the signal.
-
Limitations of Fixed Percentage Stop-Loss: The fixed 1% stop-loss range may not be suitable for all market environments; in higher volatility markets, it may be too tight and trigger prematurely.
- Solution: Consider using volatility-based dynamic stop-loss settings, such as multiples of the Average True Range (ATR).
-
Trend Transition Lag: EMA crossovers are a lagging indicator; by the time the signal appears, the actual trend transition may have been underway for some time.
- Solution: Introduce more sensitive short-term indicators as supplements to capture early signs of trend changes.
-
Parameter Sensitivity: Strategy performance is sensitive to the choice of EMA periods; 50 and 200 may not be optimal choices for all market environments.
- Solution: Optimize the EMA period parameters through historical backtesting, or consider using multiple sets of moving averages for confirmation.
-
Market Extreme Condition Risks: In market gap or extreme volatility situations, preset stop-losses may not execute as planned.
- Solution: Consider using margin management and position size control to limit risk exposure per trade.
Strategy Optimization Directions
Based on strategy analysis, here are several possible optimization directions:
-
Introduce Trend Strength Filter:
Add indicators such as the Average Directional Index (ADX) to assess trend strength, executing EMA crossover signals only when trends are significant, avoiding false signals in range-bound markets. This optimization can significantly reduce unnecessary trades and improve win rates. -
Dynamic Risk Management:
Change the fixed percentage stop-loss to volatility-based dynamic stop-loss, such as using 0.5-2 times ATR as the stop-loss distance. This method can better adapt to price volatility characteristics in different market environments. -
Multi-Timeframe Confirmation:
Consider introducing multi-timeframe confirmation mechanisms, for example, executing trades only when both daily and weekly charts show aligned EMA crossovers. This helps reduce false signals and improve trade quality. -
Add Volume Confirmation:
When EMA crossover signals appear, add volume anomaly detection as an auxiliary confirmation condition to ensure there is sufficient market participation to support the formation of a new trend. -
Optimize Risk-Reward Ratio:
Determine the optimal risk-reward ratio for trades under different market conditions through historical backtest data analysis, rather than using a fixed 1:2 ratio. In some market conditions, 1:1 or 1:3 may perform better. -
Partial Take-Profit Strategy:
Implement a staged take-profit mechanism, allowing partial position closing when different profit targets are reached, both securing profits and giving trends sufficient space to develop.
Summary
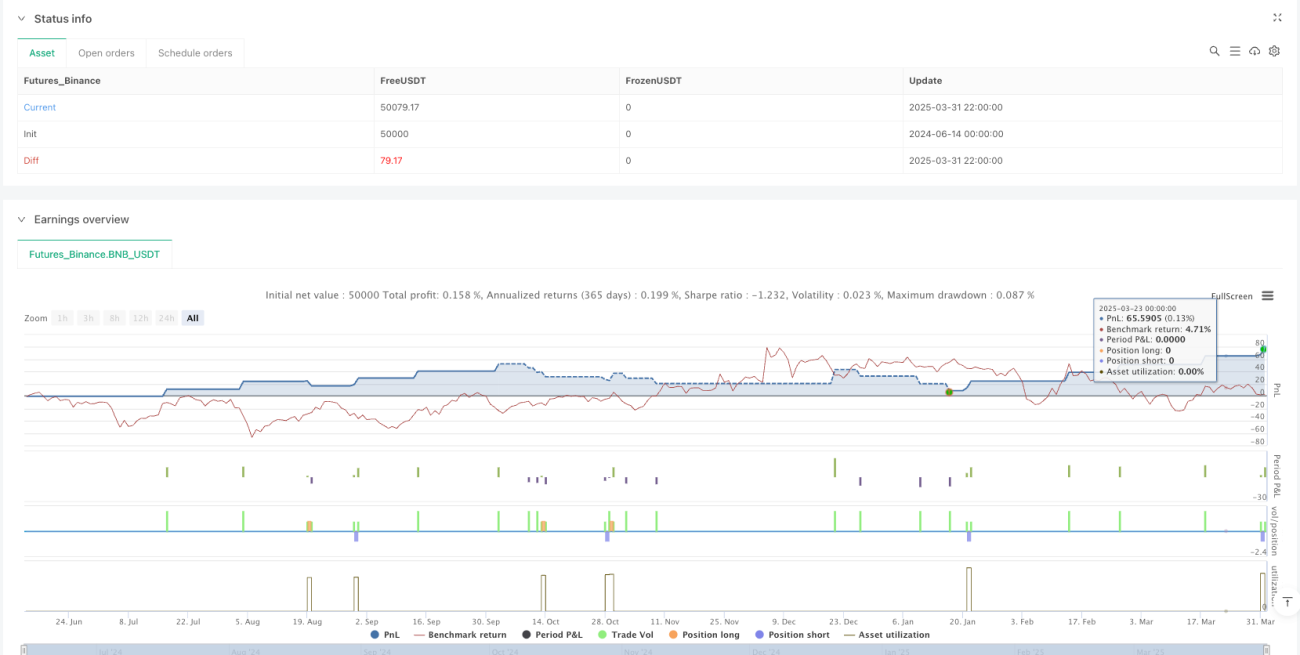
The Multi-EMA Crossover Momentum Strategy with Risk-Reward Optimization is a quantitative trading system that combines classic technical analysis with modern risk management. By using the crossover of 50-day and 200-day EMAs to provide trend direction, while utilizing preset stop-loss and take-profit mechanisms to control risk, the strategy forms a disciplined trading framework.
Although the strategy has advantages such as strong trend capture capability and automated risk management, it may face challenges of increased false signals in range-bound markets. Through introducing trend strength filters, dynamic risk management, and multi-timeframe confirmation, the strategy's robustness and adaptability can be further enhanced.
Overall, this is a quantitative strategy suitable for medium to long-term investors, particularly applicable for capturing major market trend reversal points. For traders willing to follow systematic trading rules and focus on risk management, this strategy provides a clear structured and easy-to-execute quantitative trading framework. Through continuous backtesting and parameter optimization, this strategy has the potential to maintain stable performance across different market environments.
- 1