
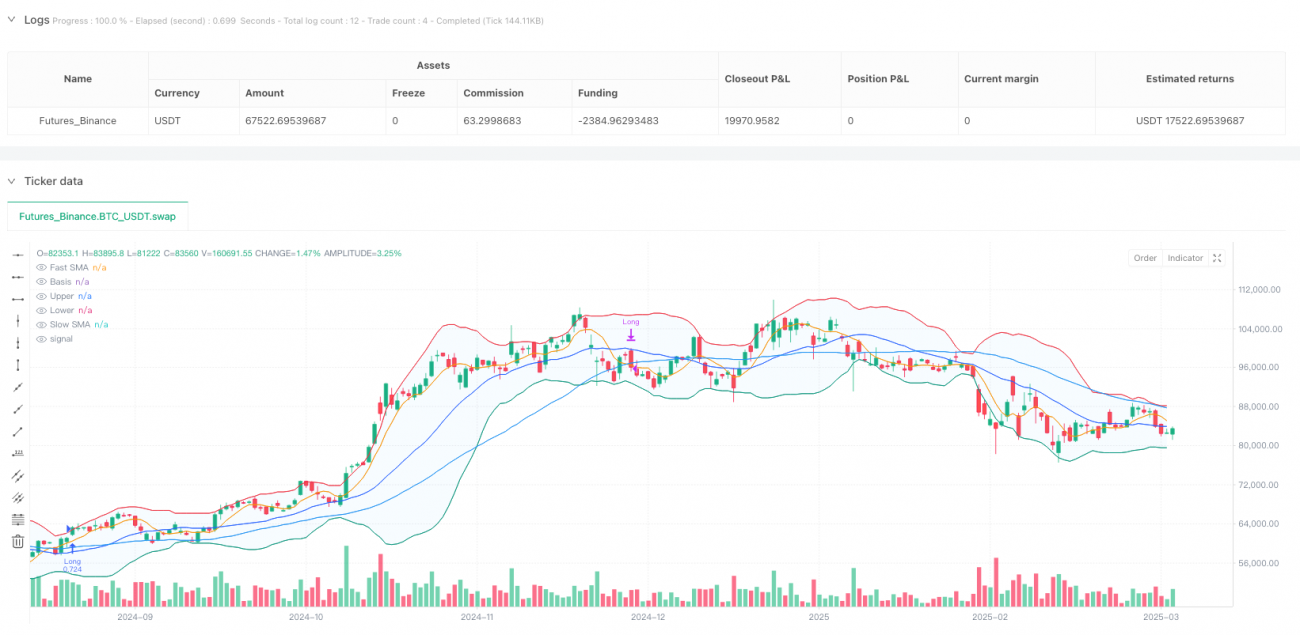
Overview
The Bollinger Bands with Dual SMA Momentum Enhanced Quantitative Trading Strategy is a trend-following system specifically designed for market volatility. This strategy cleverly integrates the volatility channel of Bollinger Bands with a dual moving average trend confirmation mechanism, forming a multi-condition filtering trading decision framework. The core of the strategy lies in capturing strong signals when prices break through the upper Bollinger Band, and confirming trend direction through the positional relationship between fast and slow moving averages. It only enters long positions when multiple conditions are simultaneously satisfied, thereby improving trading accuracy and reliability.
Strategy Principles
The technical principles of this strategy are built on the synergistic effect of three core indicators:
-
Bollinger Bands System: The strategy employs a 21-period Bollinger Band with a standard deviation multiplier of 2.0, and flexibly allows selection of the basis moving average type (SMA, EMA, SMMA, WMA, or VWMA) based on parameter settings. Bollinger Bands capture the range of price volatility, providing a volatility perspective reference for trading.
-
Dual Moving Average System: The strategy introduces a 6-period Fast Simple Moving Average (Fast SMA) and a 45-period Slow Simple Moving Average (Slow SMA), forming a dual moving average system. The crossover and positional relationship between these two moving averages can effectively identify and confirm the current trend's direction and strength.
-
Multi-Condition Entry Mechanism: The strategy only establishes long positions when all the following conditions are met:
- Closing price breaks above the upper Bollinger Band (close > upper)
- Closing price is above the Slow Moving Average (close > slowSma)
- Fast Moving Average is above the Slow Moving Average (fastSma > slowSma)
This multi-condition design ensures that positions are only entered when a strong upward trend is confirmed by multiple technical indicators, effectively filtering out false breakouts and weak signals.
The position closing conditions are similarly based on clear technical indicator signals. When the closing price falls below the lower Bollinger Band or the Fast Moving Average drops below the Slow Moving Average, the strategy will automatically close positions. This design enables the strategy to cut losses or lock in profits in a timely manner, avoiding losses caused by trend reversals.
Strategy Advantages
-
Multiple Signal Confirmation Mechanism: Combining Bollinger Band breakouts with dual moving average trend confirmation significantly reduces false breakout signals, improving trade quality and success rate.
-
Adaptive Volatility: The design of Bollinger Bands inherently possesses adaptive characteristics for market volatility. The channel naturally widens in high-volatility environments and narrows in low-volatility environments, allowing the strategy to adapt to different market conditions.
-
Trend Strength Verification: By requiring not only that the price breaks through the upper Bollinger Band, but also that it is above the slow moving average, and simultaneously that the fast moving average exceeds the slow moving average, these triple conditions ensure that only strong trends trigger trades.
-
Flexible Parameter Configuration: The strategy allows users to adjust Bollinger Band length, moving average type, standard deviation multiplier, and fast/slow moving average periods, enabling optimization adjustments based on different market conditions and personal trading styles.
-
Clear Entry and Exit Logic: The trading rules of the strategy are concise and explicit, with entry and exit conditions based on objective technical indicators, reducing the influence of subjective judgment.
Strategy Risks
-
Delayed Trend Identification: Bollinger Bands and moving averages are lagging indicators, which may lead to delayed entry timing in highly volatile markets, missing some of the early gains. A solution could be to appropriately shorten the period of the fast moving average or adjust Bollinger Band parameters.
-
Frequent Trading Risk: In oscillating markets, prices may frequently break through the upper Bollinger Band and then fall back, leading to multiple trades and increased transaction costs. This can be mitigated by adding additional filtering conditions or extending the confirmation period to reduce false signals.
-
Unidirectional Trading Limitation: The current strategy only supports long trades, unable to profit in downtrend markets, resulting in insufficient capital utilization. Consider adding short trading strategies to implement bidirectional trading.
-
Parameter Sensitivity: Strategy performance is highly dependent on parameter settings, and different market environments may require different parameter combinations. It is recommended to conduct thorough backtesting and parameter optimization, or adopt an adaptive parameter adjustment mechanism.
-
Transaction Cost Impact: The strategy's set 0.1% commission and 3-point slippage may differ in actual trading, affecting real returns. Adjustments and testing should be done according to the actual fee structure of the trading platform.
Strategy Optimization Directions
-
Add Filtering Conditions: Consider adding additional conditions such as volume confirmation, trend strength indicators (like ADX), or price pattern recognition to further improve signal quality. For example, require increased trading volume when Bollinger Bands break out, or ADX values greater than a specific threshold.
-
Optimize Capital Management: The current strategy uses 100% of account funds for trading. Consider introducing risk percentage models or volatility-adjusted position management to dynamically adjust position size based on market volatility and signal strength.
-
Add Timeframe Verification: Introduce multi-timeframe analysis, requiring trend direction confirmation on higher timeframes to reduce misjudgments in oscillating markets. For instance, require trend conditions to be met simultaneously on daily and 4-hour charts.
-
Introduce Dynamic Stop-Loss Strategy: Set dynamic stop-loss levels based on ATR (Average True Range), or use trailing stops (such as following the Bollinger Band middle line or slow moving average) to better protect profits.
-
Add Bidirectional Trading Capability: Extend the strategy to support short trading, establishing short positions when opposite conditions are met (price breaks below the lower Bollinger Band and fast moving average is below slow moving average), fully utilizing downtrend profits.
-
Parameter Adaptive Mechanism: Develop a parameter dynamic adjustment mechanism based on market states, automatically optimizing Bollinger Bands and moving average parameters in different volatility and trend strength environments to improve strategy adaptability.
Conclusion
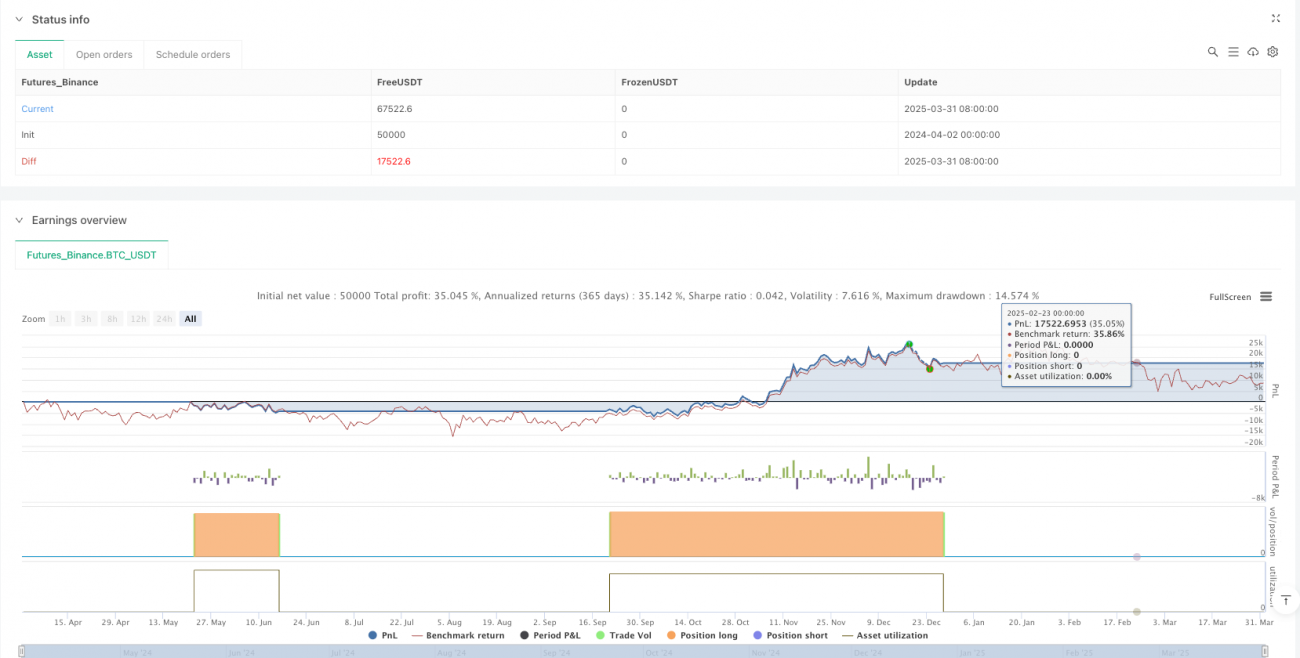
The Bollinger Bands with Dual SMA Momentum Enhanced Quantitative Trading Strategy integrates volatility and trend indicators to build a multi-level trading decision system. The core advantage of the strategy lies in its multiple condition confirmation mechanism, significantly improving signal quality and reliability. Despite certain lagging and parameter sensitivity issues, with proper risk management and parameter optimization, this strategy can achieve solid performance in markets with clear trends.
Further optimizations can be approached from aspects such as adding filtering conditions, improving capital management, introducing multi-timeframe analysis, and developing parameter adaptive mechanisms to make the strategy more comprehensive and robust. Overall, this is a clearly structured and logically rigorous trend-following strategy, suitable for traders with a certain understanding of technical analysis, especially in medium to long-term trend-oriented market environments.
/*backtest
start: 2024-04-02 00:00:00
end: 2025-04-01 00:00:00
period: 1d
basePeriod: 1d
exchanges: [{"eid":"Futures_Binance","currency":"BTC_USDT"}]
*/

//@version=6
strategy("BTC Bollinger Bands w Fast and Slow SMAs", overlay=true, commission_value=0.1, slippage=3, default_qty_type=strategy.percent_of_equity, default_qty_value=100)

length = input.int(21, minval=1)- 1