Advanced Multi-functional SuperTrend Trend Following Strategy with Automated Take Profit and Stop Loss System

Strategy Overview
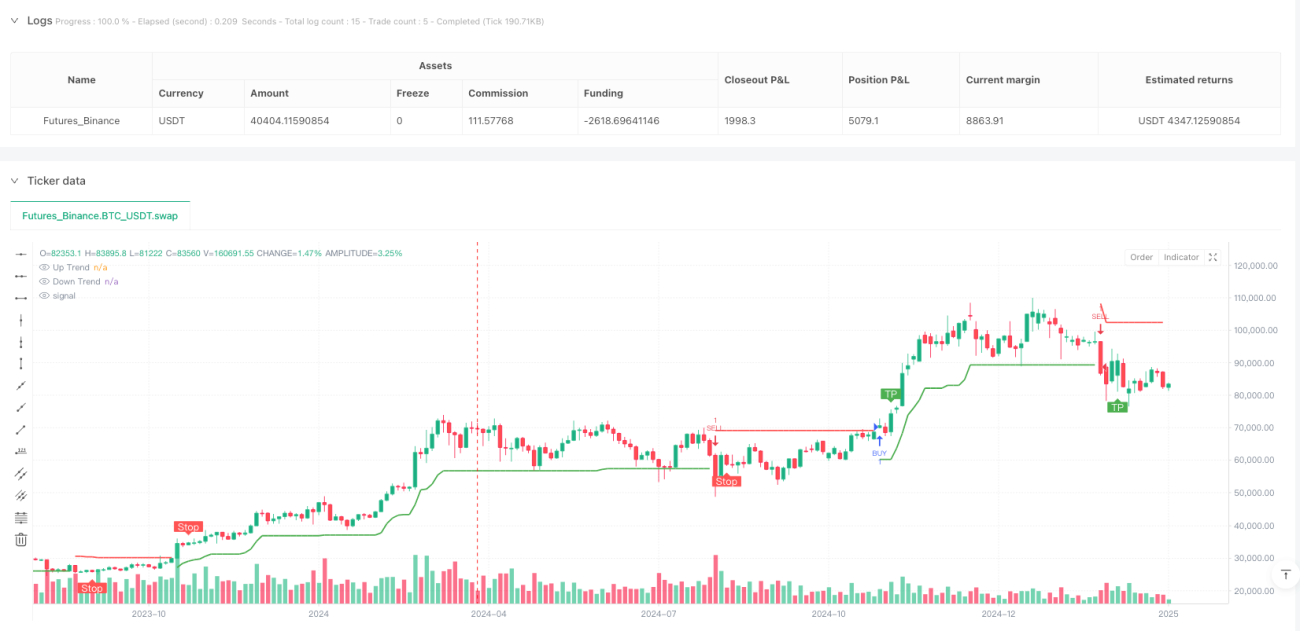
The "Advanced Multi-functional SuperTrend Trend Following Strategy with Automated Take Profit and Stop Loss System" is a quantitative trading strategy based on the SuperTrend indicator, combined with automated take profit/stop loss (TP/SL) mechanisms and entry optimization logic. The core of the strategy utilizes the SuperTrend indicator to identify market trends, generates trading signals at trend reversal points, adjusts the actual entry points through percentage offsets, and sets predefined take profit and stop loss levels to manage risk and secure profits. This approach allows traders to enter at more favorable prices after trend confirmation while having clear risk management parameters.
Strategy Principles
This strategy is based on the calculation and application of the SuperTrend indicator, with the following fundamental principles:
-
SuperTrend Calculation: First, the strategy calculates the ATR (Average True Range) to measure market volatility. Then, it determines the upper and lower bands using the ATR and a user-defined multiplier. The SuperTrend determines the current trend based on the price position relative to these bands.
-
Trend Identification: When the price breaks through the upper band, the trend turns downward (-1); when the price breaks through the lower band, the trend turns upward (1). The strategy tracks trend changes, generating buy signals when the trend changes from -1 to 1, and sell signals when the trend changes from 1 to -1.
-
Entry Optimization: The strategy doesn't enter immediately at the trend reversal point but calculates an offset price instead. For buy signals, the entry point is set lower by a certain percentage (entryOffsetPerc) from the signal price; for sell signals, the entry point is set higher by a certain percentage.
-
Automated Take Profit and Stop Loss: Once entered, the strategy automatically sets take profit (TP) and stop loss (SL) levels based on the entry price and user-defined percentage parameters. For long trades, the TP is set a certain percentage above the entry price, and the SL a certain percentage below; for short trades, the opposite applies.
-
Trigger Mechanism: The strategy monitors whether the price hits the TP or SL levels. Once hit, the trade is closed, and corresponding markers are displayed on the chart.
Strategy Advantages
-
Optimized Entry After Trend Confirmation: Unlike traditional SuperTrend strategies that enter immediately at trend line crossovers, this strategy allows waiting for price pullbacks to more favorable positions after signal generation, improving entry price favorability and reducing risks from false breakouts.
-
Automated Risk Management: The strategy has built-in TP/SL mechanisms, automatically setting clear exit conditions for each trade, avoiding the problem of traders failing to exit unfavorable trades timely due to subjective emotions.
-
Visualization of Trade Information: The strategy marks entry points, TP and SL trigger points on the chart, allowing traders to intuitively understand trade execution, which helps with subsequent analysis and strategy optimization.
-
Parameter Adjustability: The strategy provides multiple adjustable parameters, including ATR period, ATR multiplier, TP/SL percentages, and entry offset percentage, allowing traders to adjust according to different market environments and personal risk preferences.
-
Bidirectional Trading: The strategy supports both long and short trading, enabling profit in both upward and downward trends, maximizing market opportunities.
Strategy Risks
-
False Breakout Risk: Although the strategy mitigates this problem through entry offset, the market may still exhibit short-term fluctuations that break the trend and then resume the original trend, leading to unnecessary trading signals and losses.
-
Limitations of Fixed Percentage Stop Loss: The strategy uses fixed percentages for stop losses, which may not always be optimal. In highly volatile markets, fixed percentage stops may be too small, causing frequent triggers; in low volatility markets, they may be too large, resulting in excessive losses.
-
Parameter Optimization Challenges: Finding the optimal ATR period, multiplier, and TP/SL ratios requires extensive historical data testing and optimization, and the optimal parameters may need adjustment as market conditions change.
-
Gap Risk: In cases of price gaps, the actual stop loss price may be far lower or higher than the set stop loss level, causing actual losses to exceed expectations.
-
Liquidity Risk: In markets with insufficient liquidity, entry or exit orders may not be executed at expected prices, leading to increased slippage and decreased strategy performance.
Solutions:
- Combine other indicators or conditions for trend confirmation to reduce false breakout risk
- Adopt dynamic stop loss methods, such as setting stops based on ATR rather than fixed percentages
- Continuously test and adjust parameters for different market cycles and environments
- Manual monitoring and intervention may be required for highly volatile markets
- When used in low liquidity markets, increase slippage considerations or avoid trading
Strategy Optimization Directions
-
Adaptive Parameter Adjustment: Currently, the strategy uses fixed ATR periods and multipliers. It can be optimized to automatically adjust these parameters based on market volatility. For example, increasing the ATR period or decreasing the multiplier when volatility increases, and vice versa when volatility decreases, to adapt to different market environments.
-
Multi-timeframe Analysis: Introducing multi-timeframe confirmation mechanisms, executing trades only when the higher timeframe trend direction aligns with the current signal, can reduce counter-trend trading and false breakout risks.
-
Dynamic Take Profit and Stop Loss Settings: Changing fixed percentage TP/SL to dynamic values based on ATR or volatility better reflects current market conditions, avoiding stops that are too tight in high volatility environments or too wide in low volatility environments.
-
Adding Volume Confirmation: Incorporating volume analysis to confirm trend validity, for example, confirming signals only when price breakouts are accompanied by sufficient volume, can reduce false breakout risks.
-
Partial Profit Locking Mechanism: Adding partial position closing functionality, closing part of the position when the price reaches specific profit levels, both secures partial profits and gives remaining positions space to follow the trend, improving overall risk-reward ratio.
These optimization directions are important because they enable the strategy to better adapt to market changes, reduce false signals, and enhance the robustness and long-term profitability of the strategy. Especially adaptive parameters and dynamic TP/SL settings can significantly improve the strategy's performance consistency across different market environments.
Conclusion
The Advanced Multi-functional SuperTrend Trend Following Strategy combines the advantages of classic trend following with modern risk management techniques, identifying market trends through the SuperTrend indicator while enhancing trading results through optimized entry points and automated TP/SL mechanisms. Its most notable feature is seeking optimal entry points after trend signal confirmation while setting clear profit and risk control parameters for each trade.
The strategy's strength lies in its complete trading system architecture, with clear specifications from signal generation, entry optimization to risk management, suitable for traders seeking to profit in trending markets while controlling risk. However, like all trend following strategies, it may generate more false signals and losing trades in oscillating markets.
To further enhance strategy performance, traders should consider adding adaptive parameter adjustments, multi-timeframe confirmation, and dynamic risk management mechanisms to better adapt to different market environments. Ultimately, this strategy provides a good foundation framework that traders can customize and optimize according to their own needs and market characteristics.
- 1