Ghost Moving Average with Momentum Integration and Fibonacci Target/Stop-Loss Strategy

Overview
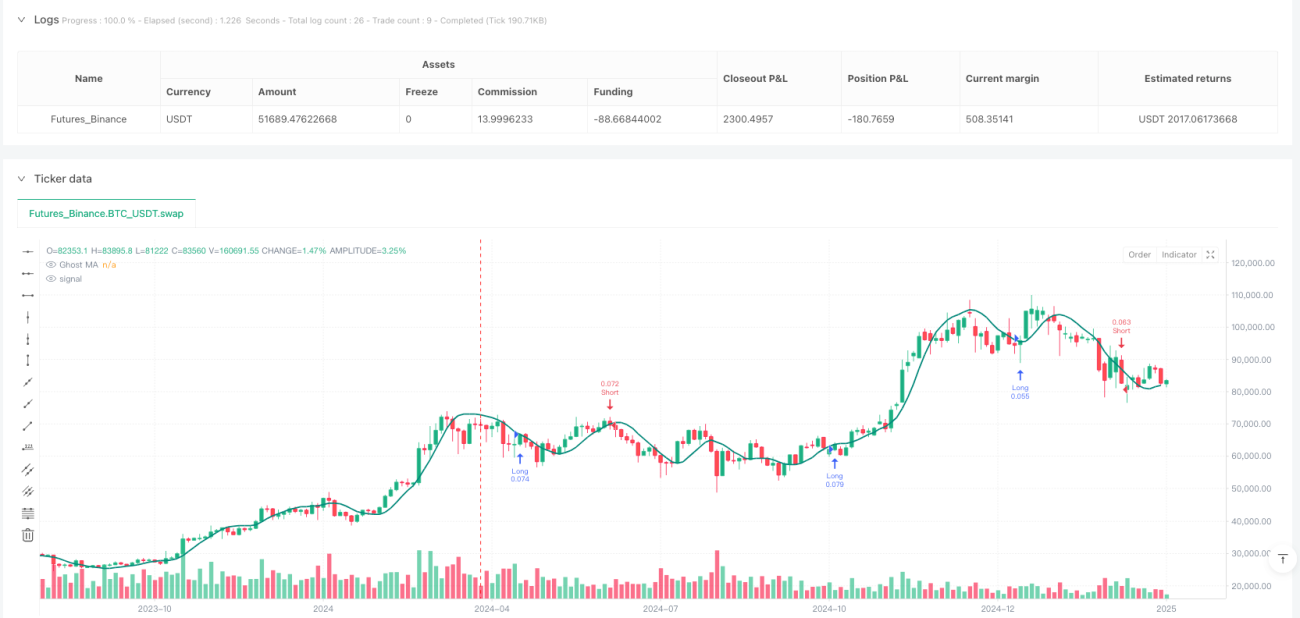
This strategy is a comprehensive trading system that combines multiple technical indicators, primarily integrating the Ghost Moving Average (GMA), Momentum Oscillator, and Fibonacci retracement levels to construct a complete trading framework. The strategy uses the Ghost Moving Average to determine market trend direction, combines the momentum indicator to verify signal strength, and employs Fibonacci levels to automatically set target prices and stop-loss points, achieving automated risk management. Additionally, the strategy includes a real-time trading dashboard that provides traders with key information and decision support.
Strategy Principles
-
Ghost Moving Average (GMA): This is the core component of the strategy, providing more sensitive price trend signals than traditional moving averages through a special calculation method. The specific formula is: first calculate twice the half-period weighted moving average (WMA) minus the full-period weighted moving average, then apply another weighted moving average with a period equal to the square root of the original period to the result.
-
Momentum Indicator: The strategy uses the difference between the current price and the price from a specific period ago to measure market momentum, smooths it using an exponential moving average (EMA), and then normalizes it through standard deviation, making the momentum signal more stable and reliable.
-
Trend Determination: Market trend is determined by calculating the slope of the Ghost Moving Average, with a positive slope indicating an uptrend and a negative slope indicating a downtrend.
-
Fibonacci Target Prices and Stop-Loss: The strategy calculates Fibonacci levels based on the highest and lowest prices within the lookback period, using 0.618, 1.0, and 1.618 as target prices, and 0.382 as the stop-loss level.
-
Entry Conditions:
- Long Entry: Price crosses above the Ghost Moving Average and normalized momentum is positive
- Short Entry: Price crosses below the Ghost Moving Average and normalized momentum is negative
Strategy Advantages
-
Dual Confirmation of Trend and Momentum: By combining the Ghost Moving Average and momentum indicator, the strategy can effectively reduce false signals, triggering trading signals only when both indicators meet their conditions simultaneously.
-
Adaptive Risk Management: Using Fibonacci levels to automatically set target prices and stop-loss points, this method adjusts automatically based on market volatility, providing appropriate risk-reward ratios under different market conditions.
-
Visual Trading Dashboard: The built-in trading dashboard intuitively displays key information such as trend status, trading signals, entry reasons, target prices, and stop-loss levels, helping traders make quick decisions.
-
Adaptation to Market Volatility: The Ghost Moving Average is more sensitive to price changes compared to traditional moving averages, enabling faster identification of trend changes and reducing lag.
-
Clear Trading Rules: The strategy provides clear entry and exit conditions, reducing subjective judgment and helping traders maintain discipline.
Strategy Risks
-
Overtrading Risk: In oscillating markets, prices may frequently cross the Ghost Moving Average, leading to excessive trading signals. The solution is to add additional filtering conditions, such as only trading in clear trends or increasing signal confirmation periods.
-
Stop-Loss Setting Risk: Fixed-ratio Fibonacci stop-losses may not be flexible enough in highly volatile markets, potentially leading to stop-losses that are either too loose or too tight. It is recommended to dynamically adjust Fibonacci ratios based on different market conditions.
-
Parameter Sensitivity: Strategy performance is highly dependent on the setting of multiple parameters, such as GMA length and momentum period. Different markets and timeframes may require different parameter combinations. Backtesting is recommended to find optimal parameters.
-
Trend Determination Delay: Although the Ghost Moving Average is more sensitive than traditional moving averages, there is still some delay, potentially missing some opportunities in the early stages of a trend. Consider combining shorter-period indicators to detect trend changes earlier.
-
Backtesting Bias: The strategy's Fibonacci levels are calculated based on historical data, potentially introducing forward bias. This should be noted in actual trading, and more dynamic methods for calculating key levels should be considered.
Strategy Optimization Directions
-
Adaptive Parameter Optimization: Currently, the strategy uses fixed parameter settings. An adaptive mechanism could be introduced to automatically adjust GMA length and momentum period based on market volatility, maintaining optimal performance under different market conditions.
-
Multi-Timeframe Analysis: Add analysis of multiple timeframes, executing trades only when signals across multiple timeframes are consistent, which can significantly improve signal quality and success rate.
-
Dynamic Take-Profit Targets: The current strategy uses fixed Fibonacci levels as target prices. Consider dynamically adjusting target prices based on market volatility or implementing a trailing stop-profit strategy to maximize profit potential.
-
Volume Analysis: Incorporate volume indicators to verify the validity of price trends, trading only when both price and volume confirm, which can reduce false breakout signals.
-
Machine Learning Enhancement: Introduce machine learning algorithms to optimize entry conditions and parameter selection, training models through historical data to predict the best trading opportunities and risk management strategies.
-
Sentiment Indicator Integration: Add market sentiment indicators, such as volatility indices or other derivative indicators, to adjust strategy behavior under extreme market conditions and enhance risk management capabilities.
Summary
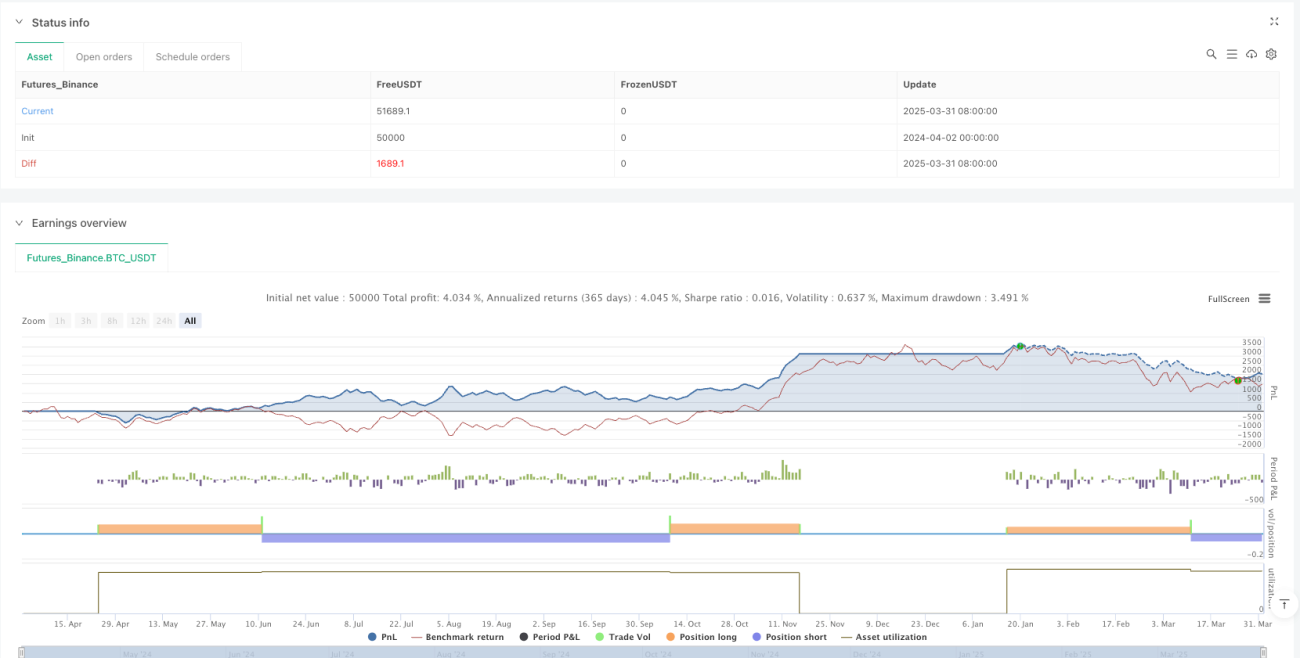
The Ghost Moving Average with Momentum Integration and Fibonacci Target/Stop-Loss Strategy is a comprehensive technical analysis trading system that provides a systematic trading framework by combining multiple indicators and techniques. The core advantages of this strategy lie in the dual confirmation mechanism of trend and momentum, as well as the adaptive risk management system based on market volatility. Although there are some inherent risks, such as parameter sensitivity and potential overtrading, the proposed optimization directions can significantly improve the strategy's robustness and effectiveness. For investors seeking systematic trading methods, this is a worthwhile strategy framework, especially in clearly trending markets. Through continuous optimization and adaptation to different market conditions, this strategy can become a powerful tool in a trader's toolkit.
/*backtest
start: 2024-04-02 00:00:00
end: 2025-04-01 00:00:00
period: 3d
basePeriod: 3d
exchanges: [{"eid":"Futures_Binance","currency":"BTC_USDT"}]
*/

//@version=5
strategy("Ghost MA + Momentum + Fib TP/SL + Dashboard", overlay=true, default_qty_type=strategy.percent_of_equity, default_qty_value=10)

// === INPUTS ===- 1