Multi-Momentum Indicator Trend Tracking Quantitative Trading Strategy

Overview
The Multi-Momentum Indicator Trend Tracking Quantitative Trading Strategy is a composite quantitative trading method that combines Exponential Moving Average (EMA), Relative Strength Index (RSI), and Moving Average Convergence Divergence (MACD). By integrating multiple technical indicators, the strategy aims to improve the accuracy and reliability of trading signals, particularly suitable for short and medium-term trading in high-volatility markets.
Strategy Principle
The core principle of this strategy is multi-indicator joint verification:
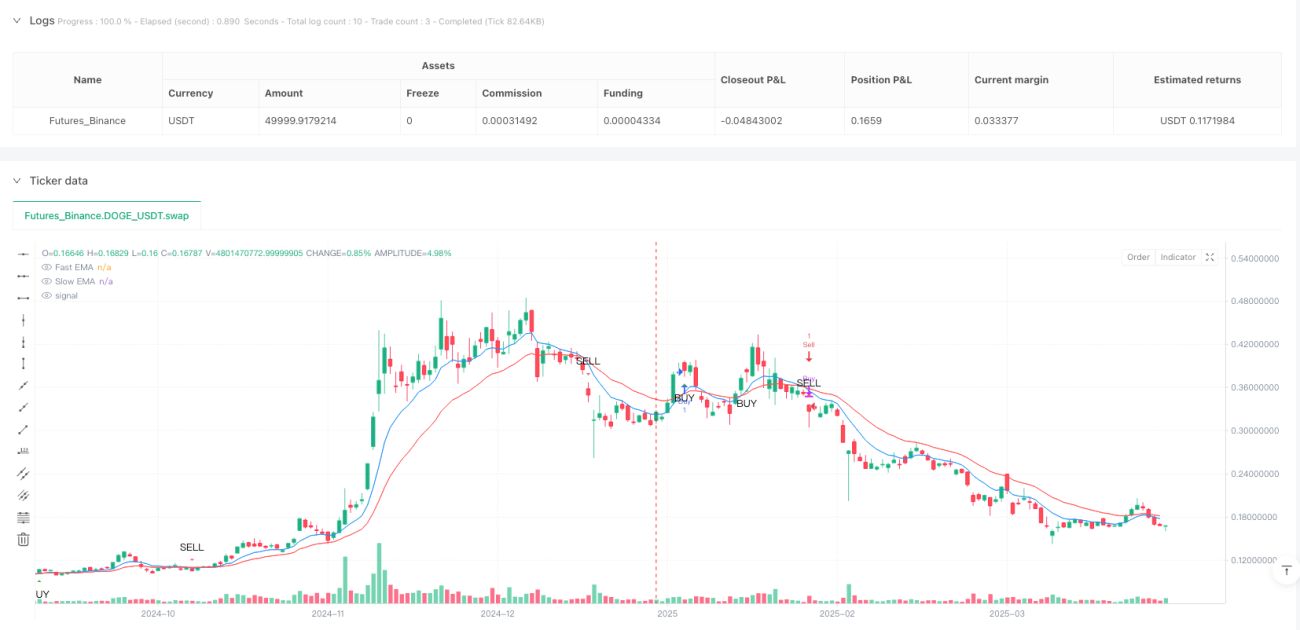
- Use fast EMA (9 periods) and slow EMA (21 periods) to judge trend direction and momentum changes
- Confirm market momentum and overbought/oversold states through RSI (14 periods)
- Verify trend momentum and direction using MACD indicator
Specific signal generation rules:
- When fast EMA crosses above slow EMA, RSI > 50, and MACD line is above signal line, generate a buy signal
- When fast EMA crosses below slow EMA, RSI < 50, and MACD line is below signal line, generate a sell signal
Strategy Advantages
- Multi-indicator joint verification significantly reduces false signal risk
- Dynamically capture market trend changes with strong adaptability
- Adjustable parameters, flexible for different market environments
- Clear signal generation logic, easy to understand and implement
- Suitable for short and medium-term trading in high-volatility markets
Strategy Risks
- Potential frequent invalid trades in range-bound markets
- Inappropriate indicator parameter selection may reduce trading efficiency
- Does not consider transaction costs and slippage
- Limited stability in single market environment
Strategy Optimization Directions
- Introduce additional filtering conditions, such as volume confirmation
- Add stop-loss and take-profit mechanisms
- Dynamically adjust EMA, RSI, and MACD parameters
- Develop machine learning-based parameter adaptive algorithms
- Introduce more market environment judgment indicators
Summary
The Multi-Momentum Indicator Trend Tracking Quantitative Trading Strategy builds a relatively robust trading signal generation system by integrating three key technical indicators: EMA, RSI, and MACD. The strategy maintains sufficient flexibility while possessing strong risk control capabilities, providing quantitative traders with a trading solution worth in-depth research.
- 1