Multi-Parameter Crossover Trend Momentum Strategy

Overview
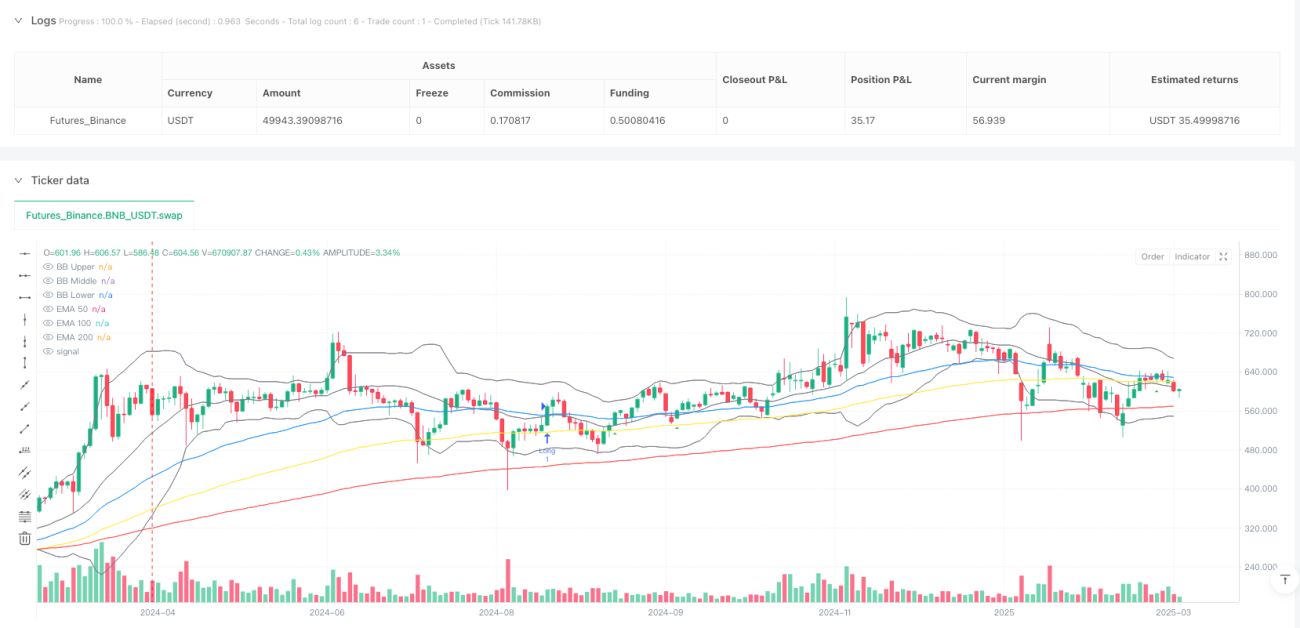
This is a complex multi-indicator trading strategy that combines four technical analysis tools: Exponential Moving Average (EMA), Relative Strength Index (RSI), Moving Average Convergence Divergence (MACD), and Bollinger Bands. The strategy aims to identify potential entry points by verifying signals through multiple indicators, focusing on capturing trend-driven price movements with a strict signal filtering mechanism.
Strategy Principle
The core principle is based on comprehensive analysis of four key technical indicators:
- Using three EMA lines of different periods to determine overall trend direction
- Using RSI to assess market momentum and overbought/oversold conditions
- Judging trend momentum through MACD line and signal line crossovers
- Combining Bollinger Bands upper and lower rails as additional price volatility reference
Specific entry logic includes:
-
Long entry conditions:
- Close price crosses above 50-day EMA
- 50-day EMA higher than 100-day EMA, and 100-day EMA higher than 200-day EMA
- RSI between 50-70
- MACD line above signal line
-
Short entry conditions:
- Close price crosses below 50-day EMA
- 50-day EMA lower than 100-day EMA, and 100-day EMA lower than 200-day EMA
- RSI between 30-50
- MACD line below signal line
Strategy Advantages
- Multi-indicator verification significantly improves signal reliability
- Strong trend tracking capability using triple EMA structure
- Precise momentum judgment through RSI and MACD combination
- Effective risk control with strict entry conditions
- Clear visual entry signals and trend indications
Strategy Risks
- Complex multi-indicator approach may cause signal delays
- Potential multiple invalid signals in range-bound markets
- Fixed parameters might not adapt to all market environments
- Lack of stop-loss mechanism risks significant drawdowns
Strategy Optimization Directions
- Introduce adaptive parameter adjustment mechanism
- Add stop-loss and take-profit strategies
- Dynamically adjust entry thresholds based on market cycles
- Incorporate volatility indicators for further signal verification
- Evaluate and optimize the best combination of indicator parameters
Conclusion
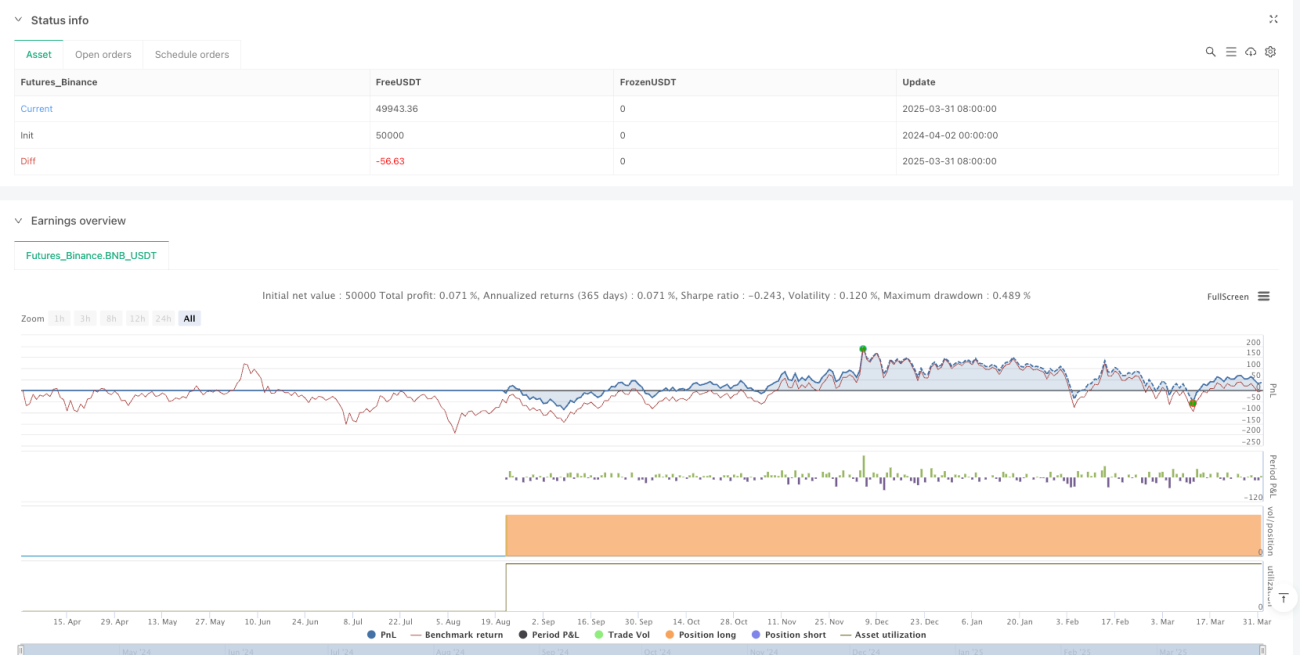
This is a highly systematic multi-parameter crossover trend momentum strategy that aims to provide more accurate and reliable trading signals through compound verification of four technical indicators. Despite its significant advantages, continuous optimization and risk management remain crucial.
- 1