
Overview
The "Market Structure Breakthrough with Volume Spike and RSI Confluence Strategy" is a multi-indicator trading approach that combines Smart Money Concept (SMC), volume breakouts, and Relative Strength Index (RSI) confirmation. This strategy primarily analyzes market structure by identifying key swing points and confirms trading signals when structural breakouts occur along with volume spikes and RSI validation. The strategy aims to identify potential market reversals or breakout points, providing more precise entry timing while reducing the risk of false breakouts.
Strategy Principles
The core principle of this strategy is to confirm trading signals through the resonance of multiple indicators. The operational flow is as follows:
- Swing Point Identification: Uses pivot functions to identify swing highs and swing lows in the market, controlled by the
swing_lenparameter that determines the lookback period. - Market Structure Analysis: Continuously records and updates the most recently confirmed swing highs and lows, which form structural support and resistance areas in the market.
- Volume Confirmation: Calculates the Simple Moving Average (SMA) of volume and identifies volume spikes when current volume exceeds the average by a specified multiplier.
- RSI Filtering: Utilizes the Relative Strength Index (RSI) as an additional filter condition to enhance signal reliability.
- Signal Generation:
- Long Signal: Price breaks above the previous swing low (structure break), accompanied by a volume spike, and RSI below 50 (indicating potential oversold conditions)
- Short Signal: Price breaks below the previous swing high (structure break), accompanied by a volume spike, and RSI above 50 (indicating potential overbought conditions)
- Position Management: Employs a fixed holding period strategy, closing positions after a specified number of bars (holdBars) following trade initiation.
Strategy Advantages
- Structured Market Analysis: The strategy identifies key swing points, providing traders with a clear perspective on market structure, helping to understand the essence of price movements.
- Multi-Indicator Confirmation: Combining volume and RSI indicators for signal confirmation significantly reduces the risk of false breakouts and improves signal quality.
- Volume Validation: Volume represents the driving force behind price movements, and the volume spike requirement ensures sufficient market participation to support price breakouts.
- RSI Contrarian Confirmation: The RSI settings (requiring RSI<50 for long signals and RSI>50 for short signals) provide a contrarian confirmation mechanism, helping to capture oversold/overbought rebound opportunities.
- Defined Holding Period: The fixed holding period avoids the difficulty of subjective exit timing while also limiting risk exposure time for each trade.
- Highly Customizable: The strategy offers multiple adjustable parameters, including swing point lookback period, volume MA length, volume multiplier, RSI period, and holding period, allowing traders to optimize for different markets and timeframes.
Strategy Risks
- False Breakout Risk: Despite using multiple indicators for confirmation, false breakouts can still occur, especially in highly volatile market environments.
- Solution: Consider adding additional confirmation indicators or increasing the number of candles required for breakout confirmation.
- Limitations of Fixed Holding Period: A fixed holding period may lead to exiting too early while a trend is still developing, or remaining in position after a trend reversal.
- Solution: Consider introducing dynamic exit mechanisms such as trailing stops or technical indicator-based exit signals.
- Parameter Optimization Trap: Excessive parameter optimization may lead to strategies that perform well on historical data but poorly in live trading.
- Solution: Conduct robust parameter optimization using sufficiently long backtest periods and test strategy robustness across different market environments.
- Lack of Stop-Loss Mechanism: The current strategy lacks an explicit stop-loss mechanism, potentially leading to excessive losses on individual trades.
- Solution: Add stop-loss mechanisms based on volatility or fixed percentage.
- Trading Frequency Issues: Depending on parameter settings, the strategy may generate too many or too few signals under certain market conditions.
- Solution: Adjust parameters to adapt to the specific volatility characteristics of markets or add frequency control mechanisms.
Strategy Optimization Directions
-
Dynamic Exit Mechanisms: The current strategy uses a fixed holding period for exits; consider introducing more dynamic exit mechanisms:
- Trailing Stop: Set dynamic stop-loss lines based on market structure or ATR (Average True Range).
- Reverse Signal Exit: Exit when signals opposite to the current position direction appear.
- Profit Targets: Set profit targets based on market structure or key resistance/support levels.
-
Risk Management Improvements:
- Introduce Stop-Loss Mechanisms: Based on volatility (such as ATR multiples) or fixed percentages.
- Position Sizing: Adjust position size based on market volatility or signal strength.
- Risk Control: Limit the maximum number of trades per day/week and maximum risk exposure.
-
Signal Quality Enhancement:
- Trend Filtering: Add long-term trend determination, only opening positions in the trend direction.
- Time Filtering: Avoid trading before and after important economic data releases.
- Volatility Filtering: Adjust strategy parameters or pause trading in environments with excessively high or low volatility.
-
Multi-Timeframe Confirmation:
- Introduce market structure analysis from longer timeframes, only trading when structures align across multiple timeframes.
- This optimization can reduce noise trades and improve the ability to capture major trends.
-
Machine Learning Enhancement:
- Use machine learning algorithms to optimize parameter selection, automatically adjusting strategy parameters based on different market environments.
- Introduce pattern recognition algorithms to enhance the accuracy of market structure identification.
Summary
The "Market Structure Breakthrough with Volume Spike and RSI Confluence Strategy" is a comprehensive trading system that provides a systematic trading approach by combining market structure analysis, volume confirmation, and RSI indicator filtering. The core advantage of this strategy lies in the resonance confirmation of multiple indicators, greatly improving the reliability of trading signals.
The main feature of the strategy is using swing points to identify key market structures, then confirming trades when prices break through these structures, combined with volume spikes and RSI indicator validation. This approach not only captures changes in market structure but also reduces the risk of false breakouts through auxiliary confirmation from volume and RSI.
Nevertheless, the strategy still has room for optimization, particularly in exit mechanisms, risk management, and signal quality. By introducing more dynamic exit strategies, improving risk management systems, and enhancing signal filtering mechanisms, the robustness and profitability of the strategy can be further improved.
Most importantly, traders using this strategy should understand the market structure concepts behind it, rather than mechanically following signals. Understanding the essence of market structure changes, combined with auxiliary analysis from volume and RSI indicators, is key to truly unleashing the potential of this strategy.
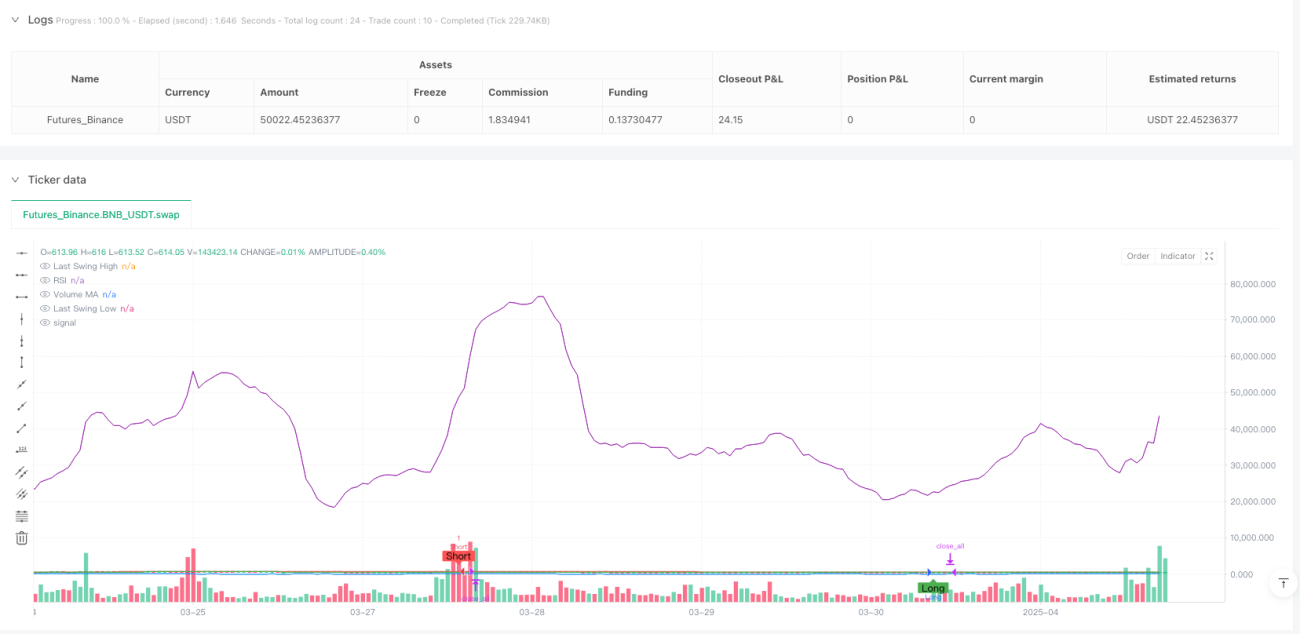
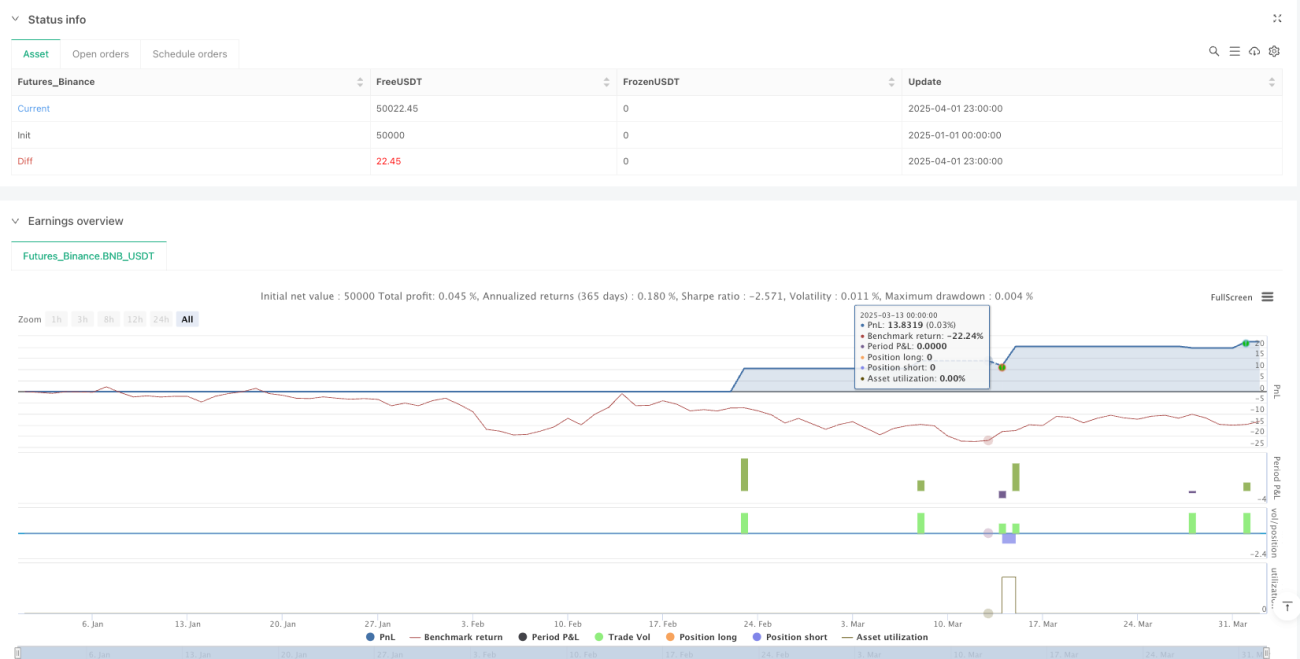
/*backtest
start: 2025-01-01 00:00:00
end: 2025-04-02 00:00:00
period: 1h
basePeriod: 1h
exchanges: [{"eid":"Futures_Binance","currency":"BNB_USDT"}]
*/

//@version=5
strategy("SMC Structure Break with Volume Spike + RSI Confluence", overlay=true, initial_capital=100000, currency=currency.USD)

// ===== INPUTS =====- 1