
Overview
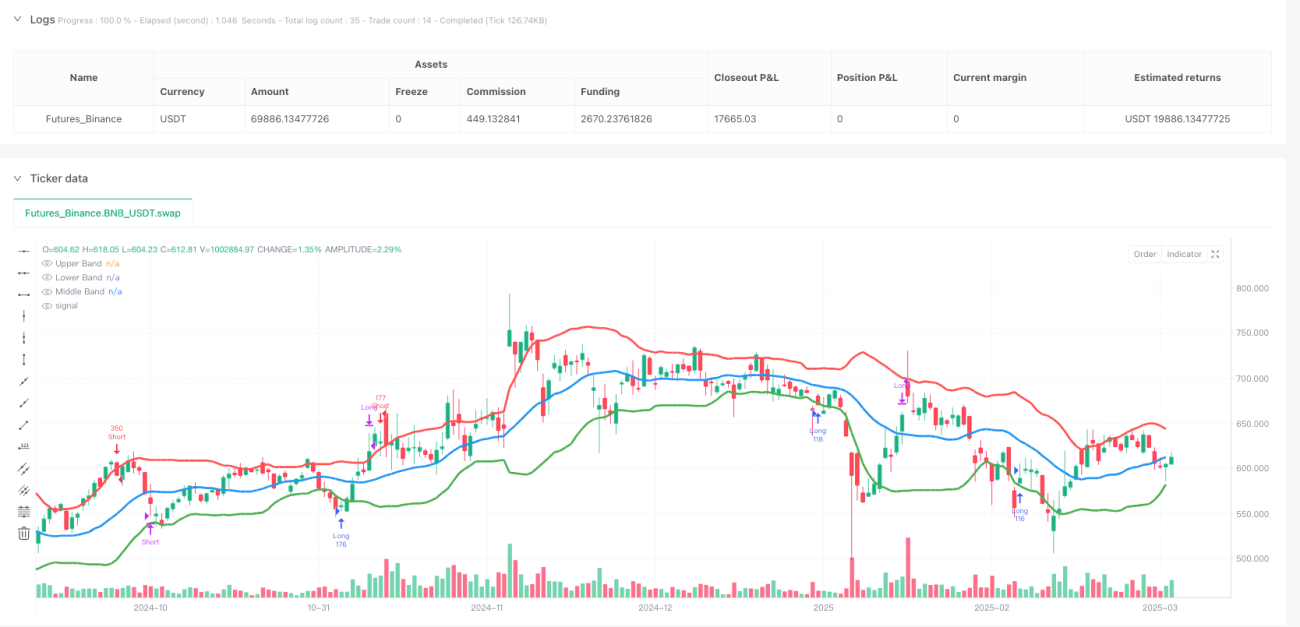
The Multi-Timeframe Bollinger Band Breakout Reversion Strategy is a mean-reversion trading system based on price volatility, focused on capturing market corrections after excessive expansion. This strategy utilizes the Bollinger Bands indicator (composed of a 20-period Simple Moving Average and 1.5 standard deviations) to identify extreme market behavior and executes trades when specific conditions are triggered. When price completely breaks above the upper band and then retraces, or breaks below the lower band and then rebounds, the system generates short or long signals respectively, combined with precise risk management mechanisms to ensure controlled risk for each trade while targeting a 3:1 reward ratio.
Strategy Principles
The core principle of this strategy is based on mean reversion theory, which suggests that prices tend to revert to their mean after significant short-term deviations. The specific implementation logic is as follows:
-
Signal Identification Mechanism:
- Short Condition: When a candle forms completely above the upper band (open, close, and low all higher than the upper band), and within the next four candles, the price breaks below the signal candle's lowest point, triggering a short signal.
- Long Condition: When a candle forms completely below the lower band (open, close, and high all lower than the lower band), and within the next four candles, the price breaks above the signal candle's highest point, triggering a long signal.
-
Dynamic Stop Loss Setting:
- Short Trade: Set the stop loss at the highest point of the signal candle that broke above the upper band.
- Long Trade: Set the stop loss at the lowest point of the signal candle that broke below the lower band.
-
Precise Position Calculation:
- The system dynamically determines the quantity for each trade based on a fixed risk amount (4000 Indian Rupees) and the real-time calculated stop loss distance, ensuring consistent risk exposure regardless of market volatility.
-
Progressive Stop Loss Management:
- When a trade profits reach twice the risk amount, the stop loss moves to the entry price (breakeven), securing partial profits.
- When profits reach three times the risk amount, the system automatically closes the position, completing the trade.
-
Effectiveness Time Window:
- After a signal candle appears, the system only considers breakouts within the next 4 candles; beyond this window, the signal becomes invalid, avoiding delayed trades.
Strategy Advantages
-
Precise Risk Control: By dynamically calculating trading quantity, the maximum risk for each trade is fixed at 4000 Indian Rupees, achieving precise risk management.
-
Adaptive to Market Volatility: Bollinger Bands, calculated based on standard deviation, automatically adjust with market volatility changes, maintaining strategy adaptability across different market environments.
-
Clear Trading Rules: Entry, stop loss, and profit targets are clearly defined, reducing subjective judgment and improving trading discipline.
-
Progressive Risk Management: When trades move favorably, moving stops to breakeven creates "zero-risk" trades, optimizing the risk-reward structure.
-
Mean Reversion Capture: Effectively utilizes the reversion tendency after market overextension, focusing on high-probability trading opportunities.
-
Time Limit Filtering: The 4-candle validity period prevents executing outdated signals, improving trading timeliness.
-
Visual Feedback System: Thickened Bollinger Band curves provide intuitive market state references, assisting trading decisions.
Strategy Risks
-
Rapid Trend Reversal Risk: In strong trending markets, prices may not follow mean reversion logic, leading to consecutive stop losses. The solution is to add trend filters to pause counter-trend trades in strong trend environments.
-
Low Liquidity Environment Risk: In markets with insufficient volume, it may be difficult to execute large orders at ideal prices, affecting actual risk control. Consider adding liquidity detection mechanisms to reduce trading size in low liquidity environments.
-
Parameter Optimization Overfit Risk: Fixed Bollinger Band parameters (20-period SMA and 1.5 standard deviations) may perform inconsistently across different markets or periods. Implementing adaptive parameter systems that dynamically adjust based on market conditions is recommended.
-
Extreme Market Risk: During market gaps or violent fluctuations, actual stop losses may far exceed preset levels. Consider introducing more complex stop loss strategies, such as ATR-based dynamic stops or distributed price-based stops.
-
Frequent Trading Risk: In highly volatile environments, the strategy may generate too many signals, increasing transaction costs. Consider adding signal quality filters to execute only the highest quality trading opportunities.
-
Capital Management Risk: Fixed risk amounts may not be suitable for all account sizes. Implement percentage-based risk management rather than fixed amounts.
Strategy Optimization Directions
-
Multi-Timeframe Confirmation System: Introduce multi-timeframe analysis, requiring trade signals to be confirmed on higher timeframes to improve success rates. For example, only execute hourly-level trade signals when the daily chart also shows mean reversion tendencies.
-
Dynamic Bollinger Band Parameters: Implement adaptive adjustment of Bollinger Band parameters based on market volatility or instrument characteristics, dynamically selecting optimal periods and standard deviation multipliers.
-
Market Environment Filtering: Add market type recognition algorithms to execute the complete strategy in oscillating markets while selectively executing trend-following signals in trending markets, improving strategy adaptability.
-
Volume-Price Combined Analysis: Incorporate volume indicators to confirm breakout signal validity, for example, requiring noticeable volume increases with breakouts to filter false breakouts.
-
Stepped Profit Strategy: Optimize the fixed 3x risk profit model to a partial profit-taking system, such as closing 50% at 2x risk and the remainder at 3x risk, improving capital efficiency.
-
Machine Learning Optimization: Introduce machine learning models to classify historical signals, identifying features of high and low win-rate signals to establish more refined signal filtering mechanisms.
-
Correlation Analysis Integration: When trading multiple instruments in a portfolio, add correlation analysis to avoid simultaneous directional trades in highly correlated instruments, reducing systemic risk.
-
Capital Management Upgrade: Convert fixed amount risk to dynamic risk allocation based on account size, such as 0.5%-2% of total account value, achieving dynamic balance between risk and account size.
Summary
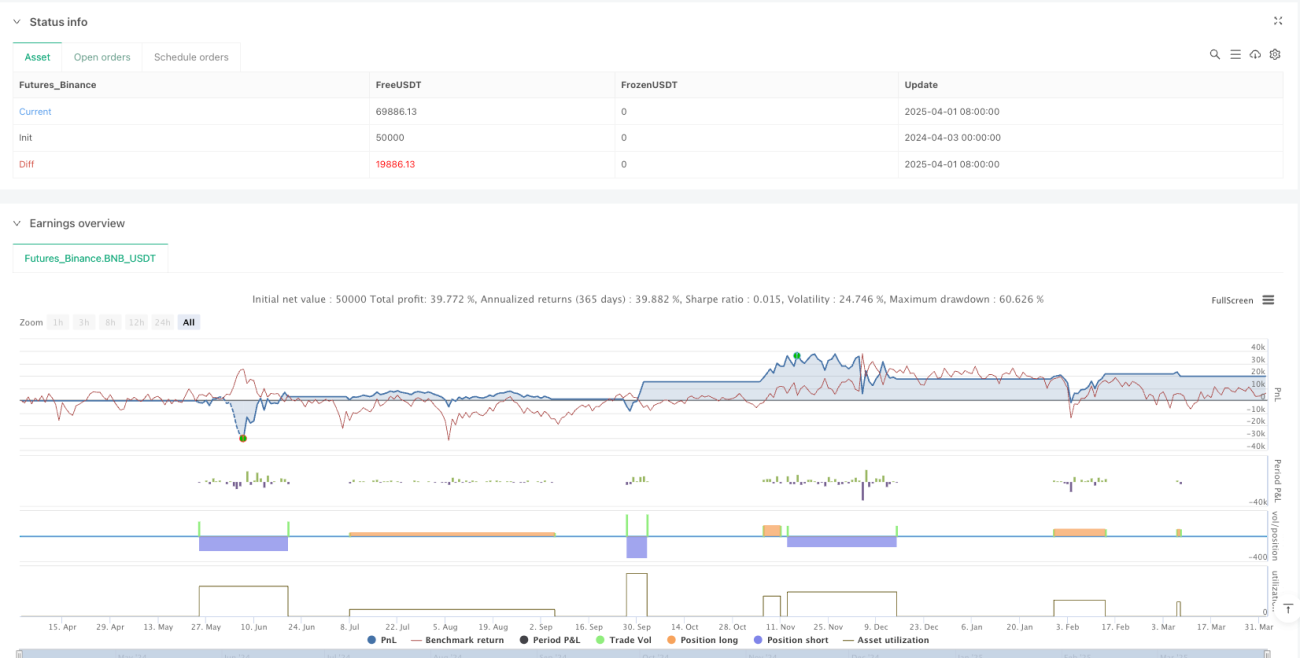
The Multi-Timeframe Bollinger Band Breakout Reversion Strategy is a highly structured, rule-based technical analysis trading system that captures mean reversion opportunities after excessive market behavior using the Bollinger Bands indicator. Its core advantages lie in precise risk control, clear trading rules, and progressive stop loss management, allowing traders to pursue substantial returns while controlling risk.
However, this strategy also faces challenges such as poor adaptability in trending markets, parameter optimization overfit, and extreme market risks. By introducing multi-timeframe confirmation, dynamic parameter adjustment, market environment filtering, and capital management upgrades, the strategy's robustness and adaptability can be significantly enhanced.
For investors seeking mean reversion trading opportunities, this strategy provides a systematic approach that maintains execution discipline while leaving sufficient optimization space for adapting to different market environments. Ultimately, successful implementation of this strategy requires deep understanding of market dynamics, continuous system optimization, and strict risk management standards.
- 1