
Strategy Overview
This Momentum Breakout Strategy is a technically-driven trading system designed to capture breakout movements aligned with the prevailing trend. The strategy cleverly combines Exponential Moving Averages (EMAs), Relative Strength Index (RSI), and Average True Range (ATR) to form a comprehensive trading framework that includes clear long/short entry conditions and volatility-based dynamic stop-loss mechanisms.
The core concept of this strategy is to wait for price breakouts of recent support or resistance levels after confirming trend direction, thereby capturing accelerated price movements. Meanwhile, the RSI indicator serves as a momentum filter, helping to avoid risky entries during overbought or oversold conditions. For risk management, the strategy employs ATR-based stop-losses and trailing stops, allowing stop points to dynamically adjust according to actual market volatility rather than using fixed levels.
Strategy Principles
The operation of this strategy is based on several key components:
-
Trend Identification: Uses two Exponential Moving Averages (EMAs) with different periods to determine market direction. The relative position of the fast EMA (default 20 periods) and slow EMA (default 50 periods) determines trend judgment. When the fast EMA is above the slow EMA, it's considered an uptrend; otherwise, it's considered a downtrend.
-
Momentum Filter: Applies a 14-period RSI indicator to avoid entries during extreme conditions. Avoids long entries when RSI is above 70 to prevent entering during overbought conditions; avoids short entries when RSI is below 30 to prevent entering during oversold conditions.
-
Breakout Logic: Detects whether prices break through the highest or lowest points within a configurable period (default 5 candles), excluding the current candle. These points serve as resistance and support levels respectively.
-
Entry Conditions:
- Long Entry: Price breaks above recent resistance + Uptrend confirmed (Fast EMA > Slow EMA) + RSI not in overbought condition
- Short Entry: Price breaks below recent support + Downtrend confirmed (Fast EMA < Slow EMA) + RSI not in oversold condition
-
Position Management:
- Stop-Loss based on ATR:
- Long stop-loss = Entry price - (ATR * multiplier)
- Short stop-loss = Entry price + (ATR * multiplier)
- Trailing Stop:
- Similarly uses ATR * trailing multiplier for both trail_points and trail_offset
- Default stop-loss and trailing multiplier are both 1.5x ATR
- Stop-Loss based on ATR:
The strategy also includes webhook alert functionality to send JSON-formatted alerts for market orders and visual cues to mark entry points on the chart.
Strategy Advantages
After in-depth analysis of the code, several significant advantages of this strategy can be summarized:
-
Synergy of Trend and Breakout: By combining EMA trend confirmation and price breakouts, the strategy avoids breakout trading against the trend, increasing the success rate of trades. This "trend-following" approach helps capture more reliable price movements.
-
Dynamic Risk Management: The ATR-based stop-loss and trailing stop mechanism allows risk control to adapt to market volatility. When volatility expands, stop-loss positions become wider; when volatility contracts, stop-loss positions become tighter. This dynamic adjustment is more in line with actual market conditions than fixed-point stops.
-
Multiple Filtering Mechanisms: Through the combination of EMA trend filtering and RSI momentum filtering, the strategy can avoid entering during unfavorable market states, reducing losses from false breakouts.
-
Clear Trading Rules: The strategy defines explicit entry and exit conditions with no room for subjective judgment, which helps eliminate emotional factors in trading decisions.
-
Customizable Parameters: The strategy provides multiple adjustable parameters, including EMA periods, RSI settings, breakout periods, and ATR multipliers, allowing users to optimize according to different market environments and trading instruments.
-
Integrated Alert Functionality: The built-in webhook alert functionality facilitates integration with automated trading systems, enhancing the strategy's practicality and execution efficiency.
Strategy Risks
Despite its reasonable design, the strategy still has some potential risks and challenges:
-
False Breakout Risk: Despite trend and RSI filtering, the market may still experience situations where prices briefly break through before quickly retracing, triggering stop-losses. Solution: Consider adding confirmation mechanisms, such as requiring prices to maintain a certain duration or amplitude after breakout before triggering entry.
-
Trend Reversal Risk: As a lagging indicator, EMA responds slowly at trend turning points, which may lead to trading in the original trend direction even when the trend has already begun to reverse. Solution: Add more sensitive trend indicators as auxiliary tools or incorporate trend strength filtering.
-
Parameter Optimization Overfitting: Excessive parameter optimization may cause the strategy to perform well on historical data but poorly in live trading. Solution: Use sufficiently long testing periods and multiple market environments for backtesting to avoid overfitting to specific market phases.
-
Market Volatility Changes: Although ATR can adapt to volatility changes, in cases of sudden substantial increases in volatility (such as major news events), stops may still not be wide enough. Solution: Consider manually adjusting ATR multipliers during special periods or adding early warning mechanisms for volatility changes.
-
Psychological Pressure from Consecutive Losses: Frequent market oscillations may lead to consecutive stop-losses, causing psychological pressure on traders. Solution: Establish reasonable fund management rules, limit single-trade risk, and implement mechanisms to pause trading during unfavorable market environments.
Strategy Optimization Directions
Based on code analysis, there are several possible optimization directions for this strategy:
-
Add Volume Confirmation: The current strategy relies solely on price data. Consider adding volume indicators as breakout confirmation conditions to reduce the risk of false breakouts. Increased volume is usually an important indicator of breakout validity.
-
Multi-Timeframe Analysis: Introduce trend determination from higher timeframes to ensure that trading direction aligns with larger trends. This can be achieved by using the security function to obtain higher timeframe data.
-
Dynamic Position Sizing: Dynamically adjust position size based on ATR or other volatility indicators, increasing positions when volatility is lower and decreasing positions when volatility is higher, to optimize the risk-reward ratio.
-
Add Profit Targets: In addition to trailing stops, consider setting ATR-based profit targets to partially take profits when specific risk-reward ratios are reached.
-
Enhance Entry Conditions: Consider adding candlestick patterns, post-breakout retest confirmation, or other technical indicators as auxiliary confirmations to improve entry quality.
-
Optimize RSI Filtering Conditions: The current RSI filtering may be too strict. Consider using dynamic RSI thresholds or basing judgments on RSI rate of change rather than absolute values.
-
Drawdown Control Mechanism: Add overall strategy drawdown control, such as pausing trading or reducing position size when reaching a specific drawdown percentage, to protect capital.
Summary
The "Momentum Breakout Trading Strategy" is a complete trading system that combines trend following, momentum analysis, and volatility-based risk management. By using EMAs to identify trend direction, RSI to filter extreme market conditions, and entering at support/resistance breakout points, this strategy provides a systematic approach to capturing breakout opportunities in the market.
The core advantages of the strategy lie in its comprehensiveness and adaptability, focusing not only on entry timing but also on risk control and position management. The ATR-based dynamic stop-loss mechanism allows the strategy to adjust protection mechanisms with market volatility, maintaining adaptability across different market environments.
Despite some potential risks, such as false breakouts and trend reversal challenges, through the suggested optimization directions like adding volume confirmation, multi-timeframe analysis, and dynamic position management, this strategy has the potential to further enhance its stability and profitability.
For technical analysis enthusiasts with certain trading experience, this is a strategy framework worth trying and further customizing, which can be parameter-adjusted and strategy-enhanced according to individual risk preferences and trading styles.
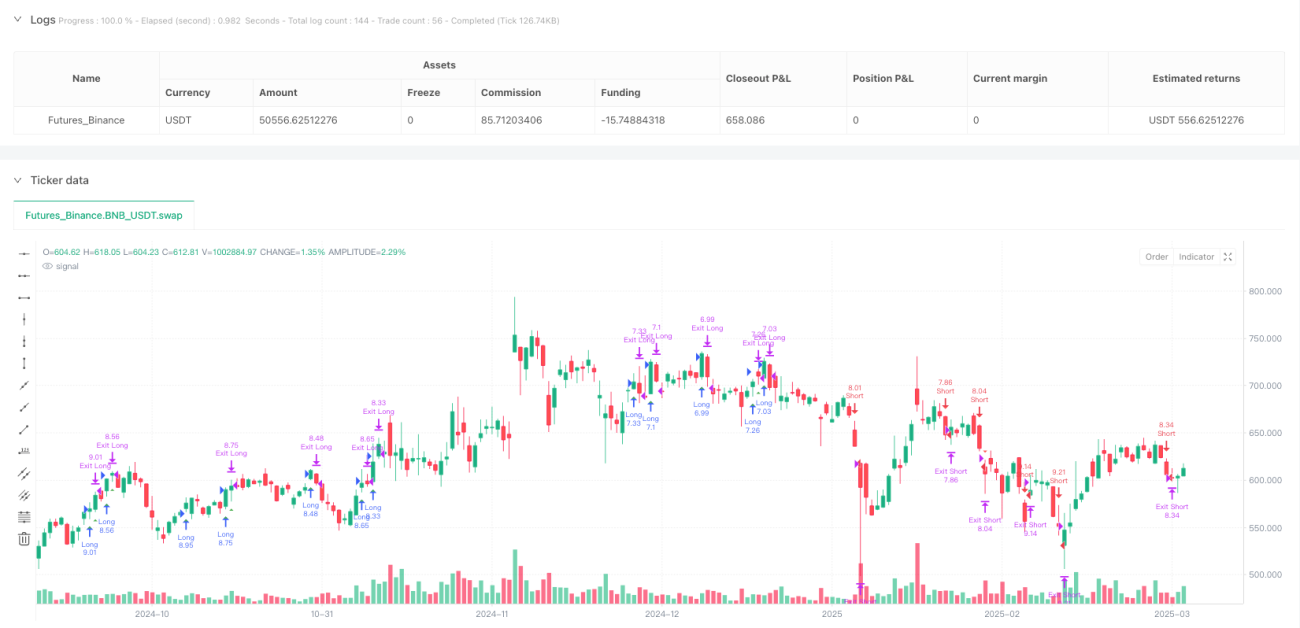
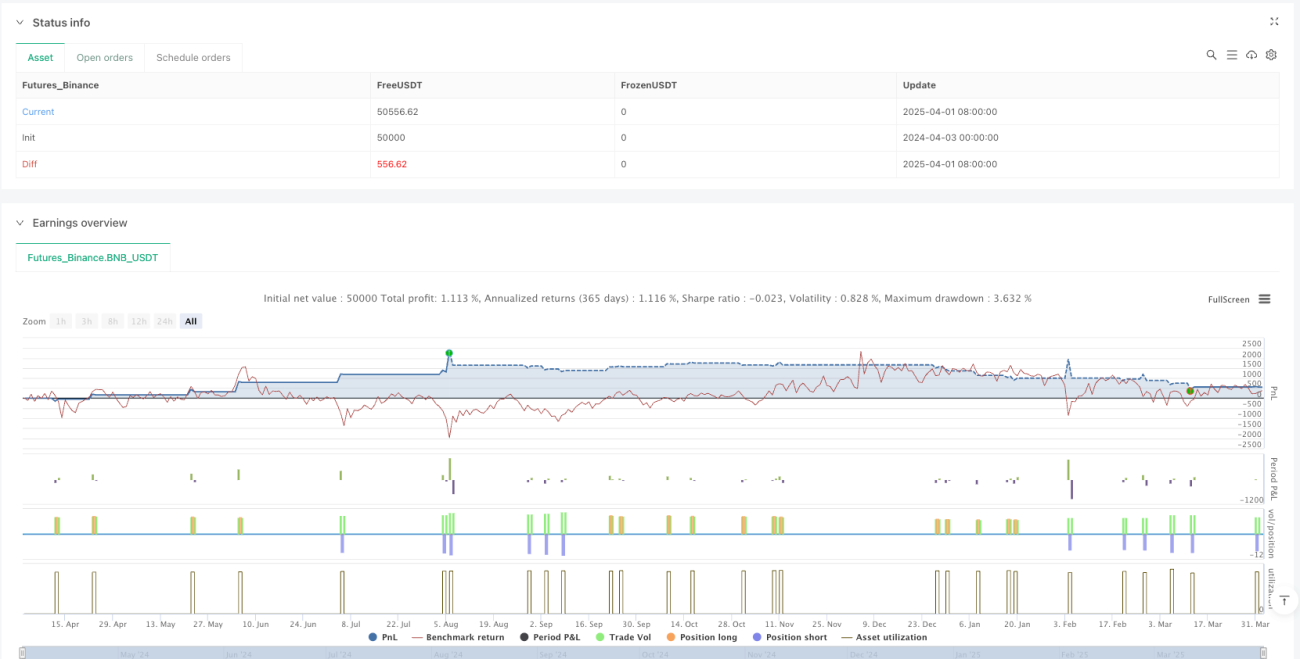
/*backtest
start: 2024-04-03 00:00:00
end: 2025-04-02 00:00:00
period: 1d
basePeriod: 1d
exchanges: [{"eid":"Futures_Binance","currency":"BNB_USDT"}]
*/

//@version=6
strategy("Ruben.Ramiro - Momentum Breakout Strategy", overlay=true, initial_capital=10000, default_qty_type=strategy.percent_of_equity, default_qty_value=10)

// ** Adjustable Parameters **- 1