
Overview
The Dynamic Support-Resistance SMA Crossover Trading Strategy is a short-term trading method that identifies high-probability trading opportunities through the crossover signals of 10-period and 20-period Simple Moving Averages (SMA), combined with price breakout and retest confirmation mechanisms. The core feature of this strategy is its triple confirmation mechanism for filtering trade signals, utilizing dynamic support and resistance levels to set stop-loss points, while applying a 1:2 risk-reward ratio to determine profit targets, forming a complete trading system framework. The strategy is particularly suitable for short-term trading on three-minute chart timeframes, improving trade success rates and protecting capital through strict entry conditions and precise risk control mechanisms.
Strategy Principles
The trading logic of this strategy is built upon the combination of three key conditions, forming a strict signal filtering system:
-
SMA Crossover Signals: The crossover of the 10-period SMA with the 20-period SMA serves as the initial signal. A bullish signal forms when the 10-period SMA crosses above the 20-period SMA; a bearish signal forms when the 10-period SMA crosses below the 20-period SMA.
-
Price Breakout Confirmation:
- Buy conditions require the closing price to break above the highest point of the 20-period SMA over the past 3 bars
- Sell conditions require the closing price to break below the lowest point of the 20-period SMA over the past 3 bars
-
Retest Confirmation:
- Buy conditions further require that the lowest price of the past 3 bars remains above the 20-period SMA
- Sell conditions further require that the highest price of the past 3 bars remains below the 20-period SMA
For risk management, the strategy employs dynamic support and resistance levels to set stop-losses:
- Stop-loss for buy trades is set at the lowest price of the past 10 bars
- Stop-loss for sell trades is set at the highest price of the past 10 bars
Profit targets are calculated based on a fixed 1:2 risk-reward ratio:
- Profit target for buy trades = Entry price + (Risk size × 2)
- Profit target for sell trades = Entry price - (Risk size × 2)
Strategy Advantages
Through deep analysis of the strategy's code implementation, the following significant advantages can be identified:
-
Multiple Confirmation Mechanism: The triple conditions of SMA crossover, price breakout, and retest significantly reduce false signals and improve signal quality. This strict filtering mechanism effectively prevents premature entry during unclear trends.
-
Dynamic Risk Management: Stop-loss points automatically adjust based on recent market volatility, rather than using fixed points, making risk control more aligned with current market conditions. This method maintains appropriate risk exposure in varying volatility environments.
-
Proportional Risk-Reward Setting: The fixed 1:2 risk-reward ratio ensures that each successful trade's gains are sufficient to offset multiple small losses, maintaining overall profitability even with a lower win rate.
-
Avoidance of Parameter Optimization Overfitting: The strategy uses classic 10 and 20-period SMAs, which typically have good universality, reducing the risk of over-optimization and curve fitting.
-
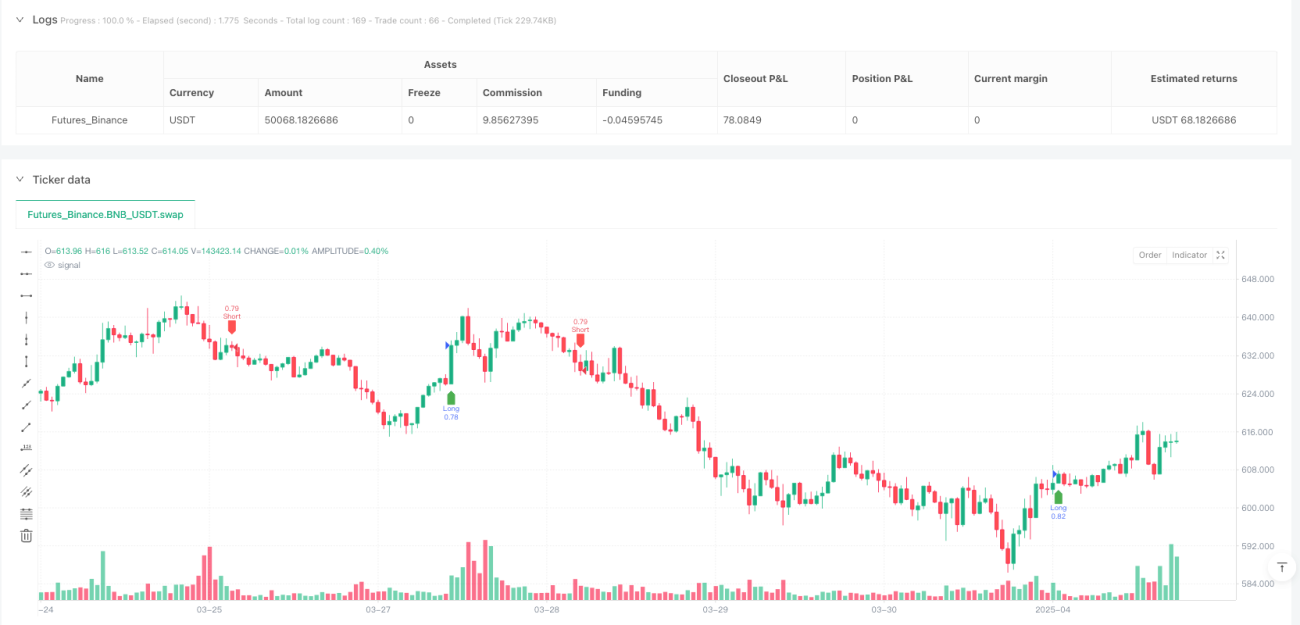
Clear Visual Signals: The code includes visualization markers for buy and sell signals, facilitating quick identification of trading opportunities and backtesting analysis.
Strategy Risks
Despite the well-designed nature of this strategy, several potential risks and limitations exist:
-
Poor Performance in Ranging Markets: In consolidating markets lacking clear trends, SMA crossover signals appear frequently but lack continuity, potentially triggering multiple stop-losses. A solution is to add a trend strength filter, such as the ADX indicator, trading only when trends are clearly defined.
-
Rapid Reversal Risk: When markets suddenly reverse, dynamic stop-losses may be set too wide, resulting in larger losses. Consider adding volatility-adjusted stop-loss mechanisms to tighten stop-loss ranges in high-volatility environments.
-
Signal Lag: Moving averages are inherently lagging indicators, potentially causing missed optimal entry opportunities near trend turning points. Consider combining momentum indicators like RSI or MACD to identify potential turning points in advance.
-
Market-Specific Dependency: Code comments suggest the strategy is designed for the gold market and may not be applicable to all trading instruments. Different markets have significantly different volatility characteristics, requiring parameter adjustments.
-
Lack of Comprehensive Money Management: Although the strategy employs a fixed percentage of account equity for trading, it lacks mechanisms to dynamically adjust position sizes based on win rates and risk-reward ratios.
Optimization Directions
Based on the strategy code analysis, here are several potential optimization directions:
-
Add Trend Strength Filtering: Integrate ADX or similar trend strength indicators, trading only when trends are sufficiently developed to avoid frequent false signals in ranging markets. This improves signal quality and reduces unnecessary trade frequency.
-
Optimize Time Frames: Consider adding multi-timeframe analysis, using higher timeframe trend directions as trade direction filters. For example, only trade when the daily chart trend direction aligns with the 3-minute chart signal, improving success rates.
-
Dynamic Risk-Reward Ratio: Adjust risk-reward ratios based on market volatility and key support-resistance levels, rather than a fixed 1:2 ratio. Consider larger profit targets in strong trends and tighter profit-taking in volatile markets.
-
Add Partial Profit Mechanisms: After reaching certain profit levels, consider partial position closing to secure profits while allowing remaining positions to continue gaining. This can be implemented through multiple profit targets.
-
Trading Session Filters: Add trading session filters for specific markets, avoiding low-liquidity or high-volatility market sessions. For the gold market, Asian sessions and European-American crossover sessions might be more suitable for this strategy.
-
Add Volume Confirmation: Integrate volume analysis as an additional confirmation indicator, increasing positions on signals supported by high volume to improve signal reliability.
Summary
The Dynamic Support-Resistance SMA Crossover Trading Strategy forms a complete and rigorous trading system by combining technical indicator crossovers, price action confirmation, and dynamic risk management. Its core strength lies in the triple confirmation mechanism substantially improving signal quality, while dynamic stop-losses and fixed risk-reward ratios ensure sound money management.
This strategy is particularly suitable for short-term traders capturing high-probability opportunities in volatile markets but may underperform in consolidating markets. Through optimizations like trend strength filtering, multi-timeframe analysis, and dynamic risk management, its stability and adaptability can be further enhanced.
Most notably, this strategy not only provides a signal generation mechanism but also includes a complete risk control framework, embodying the core philosophy of professional trading system design—equal attention to entry signal quality and capital protection mechanisms. For traders seeking opportunities in short-term volatility, this is a clearly structured, logically rigorous, and easily implementable strategy framework.
- 1