Quantitative Long-Short Trend Tracking Dynamic Stop-Loss Strategy

2
Follow
478
Followers
Overview
This is a long-short trend tracking strategy based on Average True Range (ATR) and Exponential Moving Average (EMA). The strategy achieves precise market trend capture and risk management through dynamic stop-loss and trend determination.
Strategy Principle
The core principles include:
- Calculate dynamic stop-loss points using ATR
- Determine price trend direction with EMA
- Confirm trading signals through price and stop-loss point relationship
- Optional Heikin Ashi candle optimization
Key Calculation Logic:
- Dynamic Stop-Loss = Current Price ± (ATR * Sensitivity Coefficient)
- Trend Determined by EMA and Stop-Loss Point Crossover
- Trading Signals Generated When Price Breaks Stop-Loss and EMA Crosses
Strategy Advantages
- Dynamic Risk Management: ATR adaptive stop-loss calculation
- Precise Trend Tracking: EMA quickly responds to price changes
- High Flexibility: Customizable ATR period and sensitivity
- Optional Heikin Ashi Candles for Signal Refinement
- Low-Frequency Trading, Reduced Transaction Costs
- Multi-Market and Multi-Variety Adaptability
Strategy Risks
- Potential Frequent False Signals in Volatile Markets
- Improper Parameter Settings May Cause Over-Trading
- Does Not Consider Fundamental Factors
- Potential Divergence Between Backtesting and Live Trading
Risk Control Recommendations:
- Optimize Parameters
- Combine with Confirmation Indicators
- Implement Stop-Loss and Position Management
- Continuous Monitoring and Dynamic Adjustment
Strategy Optimization Directions
- Introduce Machine Learning for Parameter Optimization
- Add Multi-Timeframe Verification
- Combine with Additional Technical Indicators
- Develop Adaptive Parameter Selection Mechanism
- Enhance Risk Adjustment Module
Optimization Goals: Improve Strategy Stability, Reduce Drawdown, Enhance Profit Efficiency
Summary
A dynamic trend tracking strategy based on ATR and EMA, achieving stable market participation through flexible stop-loss mechanisms and trend judgment. The strategy demonstrates good adaptability and risk management characteristics, requiring continuous optimization and validation.
Source
Pine
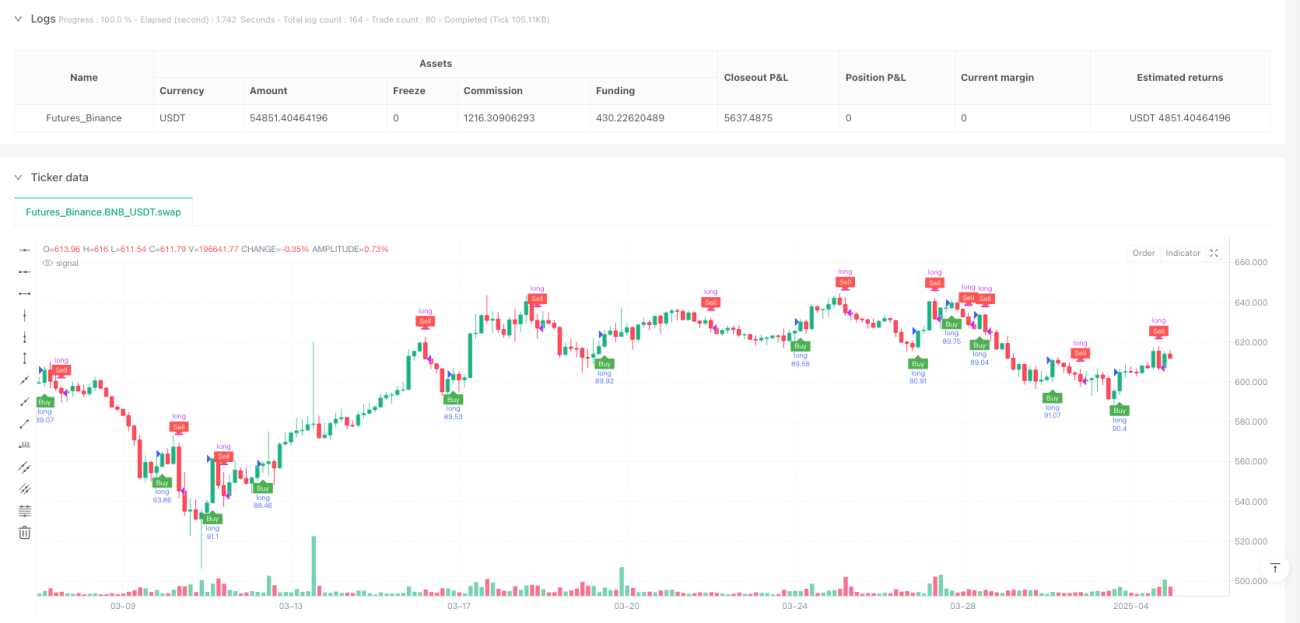
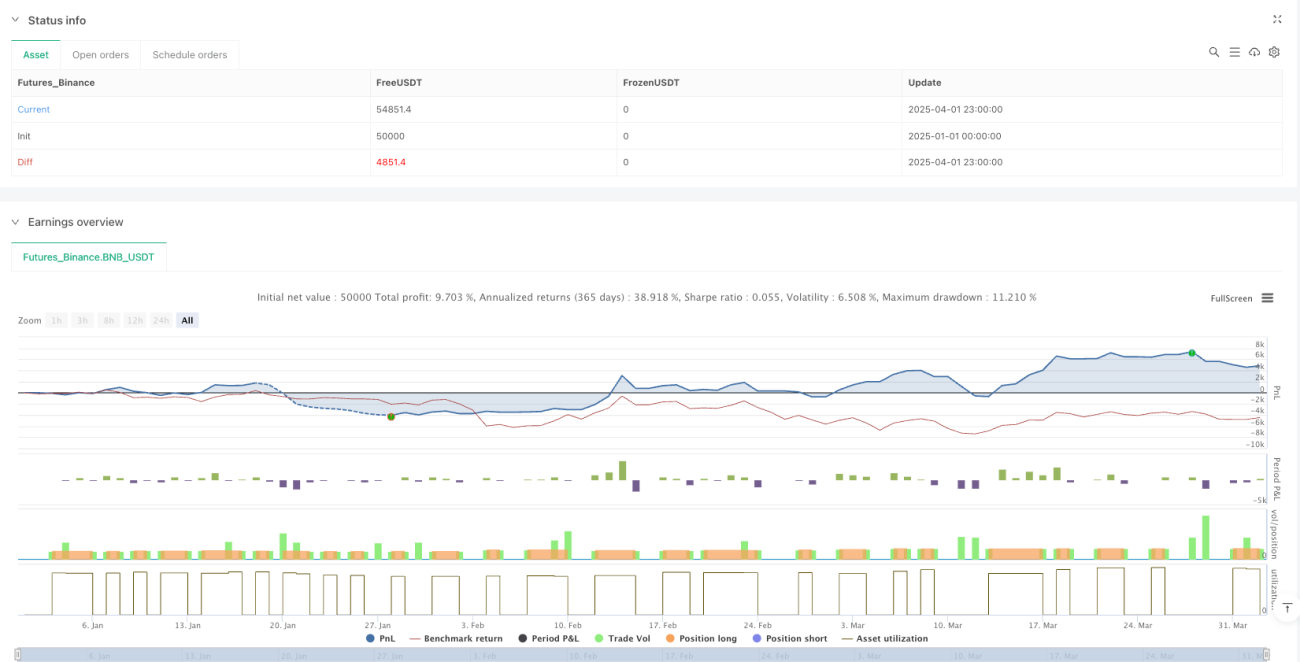
/*backtest
start: 2025-01-01 00:00:00
end: 2025-04-02 00:00:00
period: 3h
basePeriod: 3h
exchanges: [{"eid":"Futures_Binance","currency":"BNB_USDT"}]
*/

//@version=6
strategy("ducanhmaster v1", overlay=true, commission_type=strategy.commission.percent, commission_value=0.1, slippage=3, default_qty_type=strategy.percent_of_equity, default_qty_value=100)

// InputsStrategy parameters
Related strategies
Comment
All comments (0)
No data
- 1