
Overview
This is a quantitative trading strategy based on multiple exponential moving average (EMA) crossovers, designed to identify market trends by capturing crossover points of EMAs at different time periods and generate trading signals. The strategy aims to capture market momentum through progressive confirmation and provide an intuitive visualization mechanism for trend judgment.
Strategy Principles
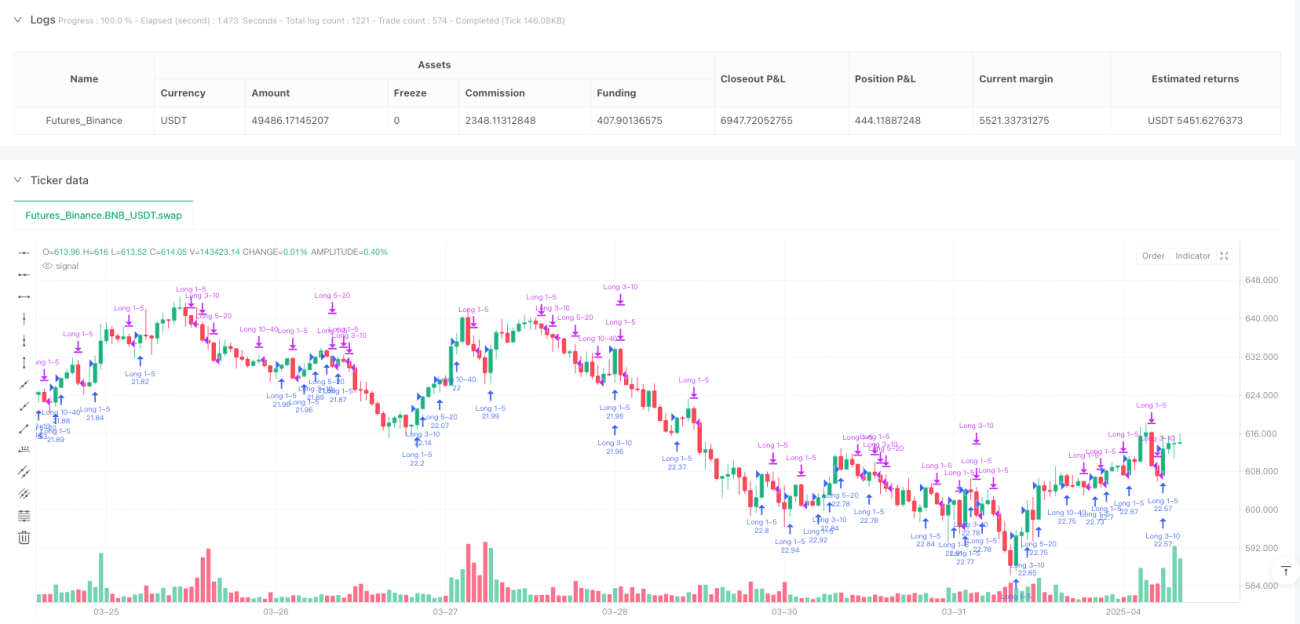
The core logic is based on crossover signals from four different EMA periods:
- First Entry Signal: 1-day EMA crosses above 5-day EMA, indicating initial upward momentum
- Second Entry Signal: 3-day EMA crosses above 10-day EMA, confirming stronger upward trend
- Third Entry Signal: 5-day EMA crosses above 20-day EMA, showing further trend development
- Fourth Entry Signal: 10-day EMA crosses above 40-day EMA, demonstrating long-term bullish momentum
The strategy intuitively displays market sentiment through color coding: blue tones represent bullish, red tones represent bearish. Color intensity reflects the relative position of short-term EMAs to long-term EMAs.
Strategy Advantages
- Progressive Confirmation: Multiple EMA crossovers provide layered trend confirmation
- Visual Feedback: Bar colors quickly present market sentiment changes
- High Flexibility: Suitable for trend-driven markets like Bitcoin
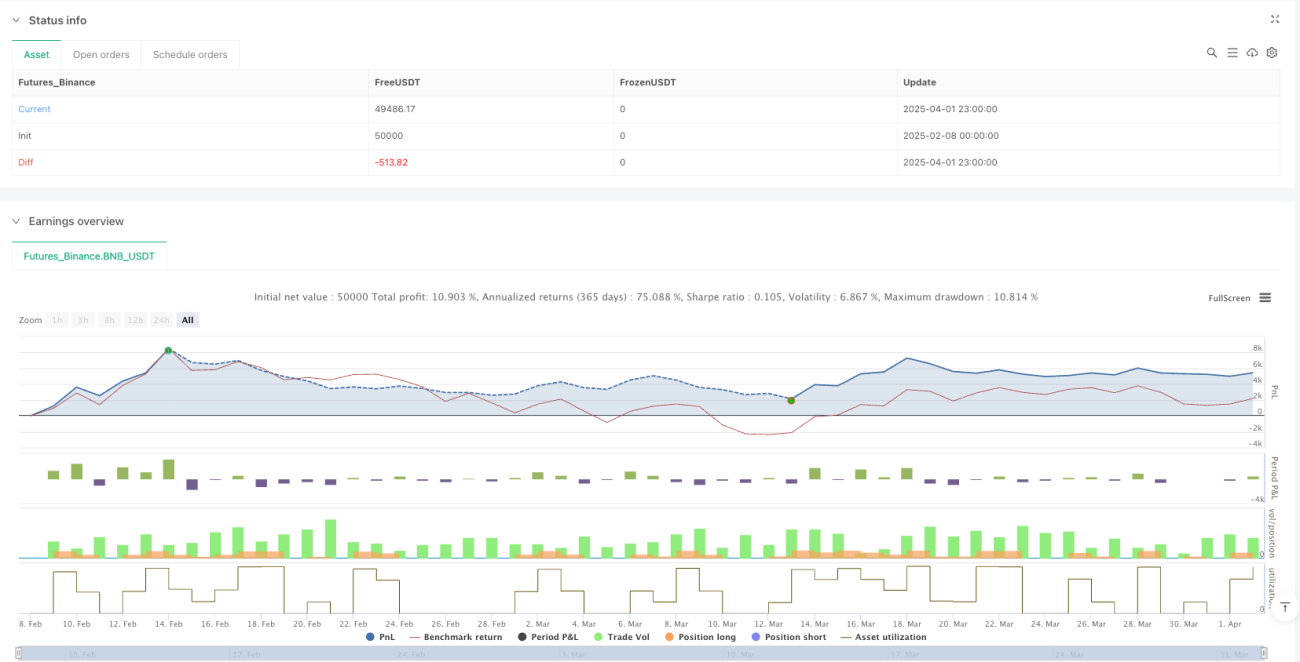
- Dynamic Position Management: Gradual position increase reduces single-trade risk
- Trend Tracking Capability: Can capture market momentum across different time scales
Strategy Risks
- Lagging Characteristic: EMAs as lagging indicators may react slowly to sudden price changes
- False Breakout Risk: Potential for generating incorrect signals in oscillating markets
- Multiple Position Risk: Pyramid-style position building may increase overall risk exposure
Strategy Optimization Directions
- Introduce additional filtering conditions, such as volume confirmation or volatility indicators
- Incorporate stop-loss mechanisms like Kelly Criterion for single-trade risk control
- Adjust EMA parameters for different market environments
- Enhance trend strength assessment module
- Introduce machine learning algorithms for dynamic entry strategy adjustment
Summary
The Multi-EMA Crossover Strategy provides traders with a systematic method of capturing market trends through progressive signal generation and intuitive visualization. Despite certain limitations, the strategy remains valuable through continuous optimization and risk management.
- 1