EMA-Assisted Extreme Point Reversal Trading Strategy

Strategy Overview
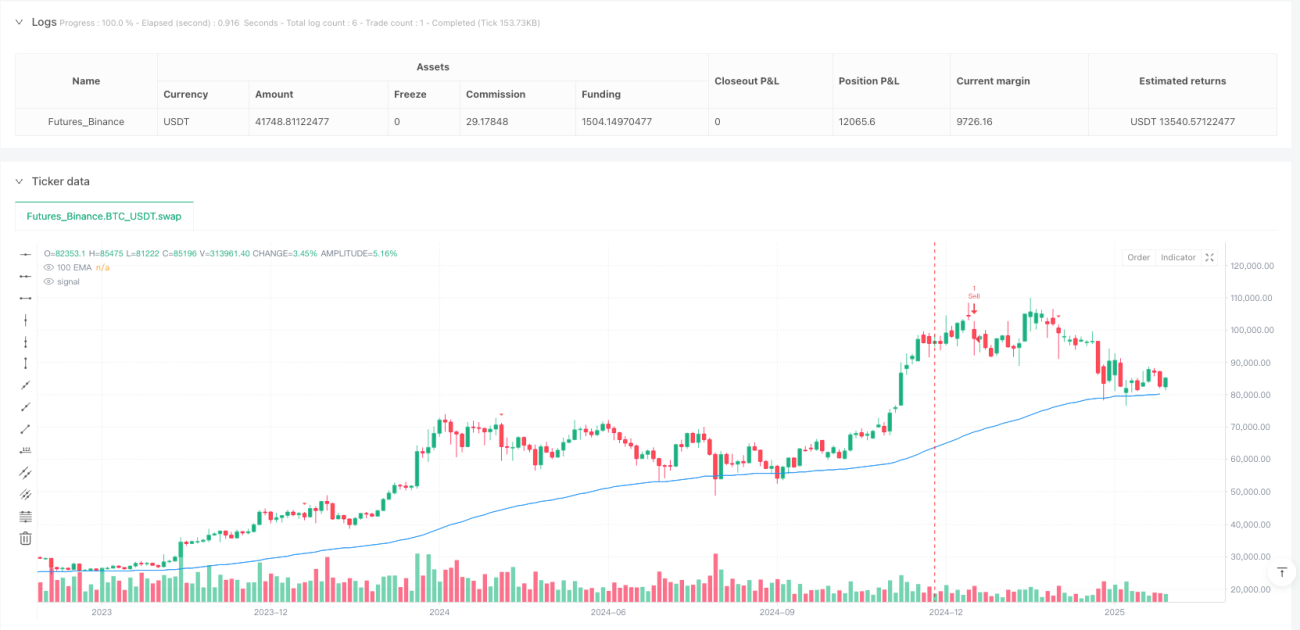
This strategy is a quantitative trading system that combines extreme point identification, technical indicators, and moving averages to capture reversal signals in overbought and oversold market conditions. The core mechanism uses CCI or Momentum indicators to identify market turning points, RSI to confirm overbought/oversold zones, and a 100-period Exponential Moving Average (EMA) as an auxiliary filter, forming a comprehensive trading decision framework. The strategy is particularly suitable for Ethereum/Tether trading on a 5-minute timeframe.
Strategy Principles
The trading logic of this strategy is based on several core elements:
-
Entry Signal Source Selection: The strategy allows traders to choose between CCI (Commodity Channel Index) and Momentum indicators as the primary entry signal, identifying potential turning points by detecting crossovers of these indicators with the zero line.
-
RSI Overbought/Oversold Confirmation: Using the Relative Strength Index (RSI) to identify overbought (RSI ≥ 65) and oversold (RSI ≤ 35) market conditions as necessary entry criteria. The strategy checks the current and previous three periods' RSI values, considering the condition met if any of them satisfies the threshold.
-
Divergence Identification (Optional): The strategy offers an option to identify regular bullish/bearish divergences. When enabled, the system looks for RSI divergence patterns within overbought/oversold regions to further confirm potential reversal signals.
-
EMA Filter: The 100-period EMA serves as a trend filter, with the strategy only considering buy signals when price is below the EMA and sell signals when price is above the EMA, ensuring trade direction is counter to the main trend.
-
Complete Entry Conditions:
- Long Entry: CCI/Momentum crosses above zero + RSI is in or recently recovered from oversold territory + (optional) bullish divergence is present + price is below 100 EMA
- Short Entry: CCI/Momentum crosses below zero + RSI is in or recently declined from overbought territory + (optional) bearish divergence is present + price is above 100 EMA
Strategy Advantages
-
Multiple Confirmation Mechanism: By combining multiple technical indicators (CCI/Momentum, RSI, EMA), the strategy provides more reliable trading signals, reducing the risk of false breakouts.
-
Flexible Parameter Settings: The strategy allows adjustment of various parameters, including the choice between CCI and Momentum indicators, RSI overbought/oversold thresholds, and indicator period lengths, enabling traders to optimize according to different market environments and personal risk preferences.
-
Counter-Trend Trading Advantage: The strategy focuses on capturing reversal opportunities in overbought/oversold areas, performing well in highly volatile markets and particularly suitable for range-bound market environments.
-
Divergence Confirmation Mechanism: The optional divergence confirmation feature enhances signal quality, helping to filter out higher probability reversal points.
-
Intuitive Visual Signals: The strategy clearly marks buy and sell signals on the chart, allowing traders to quickly identify and evaluate trading opportunities.
-
Complete Alert System: Built-in buy/sell signal alerts facilitate real-time market monitoring and trade execution.
Strategy Risks
-
Counter-Trend Risk: As a reversal strategy, it may enter too early in strong trending markets, leading to frequent losing trades. The solution is to pause using the strategy in strong trend markets or add trend strength filtering conditions.
-
Parameter Sensitivity: Strategy performance is highly dependent on parameter settings, especially RSI overbought/oversold levels and indicator periods. Different market environments may require different parameter settings, so thorough backtesting and optimization are recommended.
-
Signal Delay: Since the strategy relies on indicator crossovers and divergence patterns, there may be signal lag issues, resulting in less ideal entry points. Consider adding more sensitive short-term indicators to identify potential reversals earlier.
-
Lack of Stop Loss Mechanism: The current strategy does not define clear stop loss rules, potentially facing significant downside risk in actual trading. Implementing appropriate stop loss strategies is recommended, such as ATR-based stops or key support/resistance level stops.
-
Over-reliance on Single Timeframe: The strategy is based solely on signals from a single timeframe, lacking multi-timeframe confirmation, which may lead to erroneous judgments in the context of larger trends.
Strategy Optimization Directions
-
Add Stop Loss and Take Profit Rules: Incorporate clear stop loss and take profit rules, such as ATR-based stops, trailing stops, or fixed stops based on risk ratios, as well as profit target settings.
-
Multi-Timeframe Analysis: Integrate trend information from higher timeframes to ensure trade direction aligns with larger trends, or at least seek reversal opportunities near higher timeframe support/resistance levels.
-
Optimize Entry Logic: Consider adding volume confirmation, only confirming reversal signals when volume increases, to further improve signal quality. Changing CCI to a volume indicator has been mentioned as potentially enhancing performance.
-
Incorporate Volatility Filters: Introduce ATR or other volatility indicators to avoid trading in low volatility environments or adjust position size based on volatility.
-
Dynamic Parameter Adjustment: Implement dynamic adjustment of RSI overbought/oversold thresholds based on market environment (trending or ranging) to automatically optimize parameters.
-
Add Money Management Rules: Dynamically adjust position sizes based on signal strength and market conditions to optimize capital utilization efficiency.
-
Simplify Strategy Complexity: Evaluate each component's contribution to overall performance, potentially removing or simplifying certain conditions to improve strategy robustness and usability.
Summary
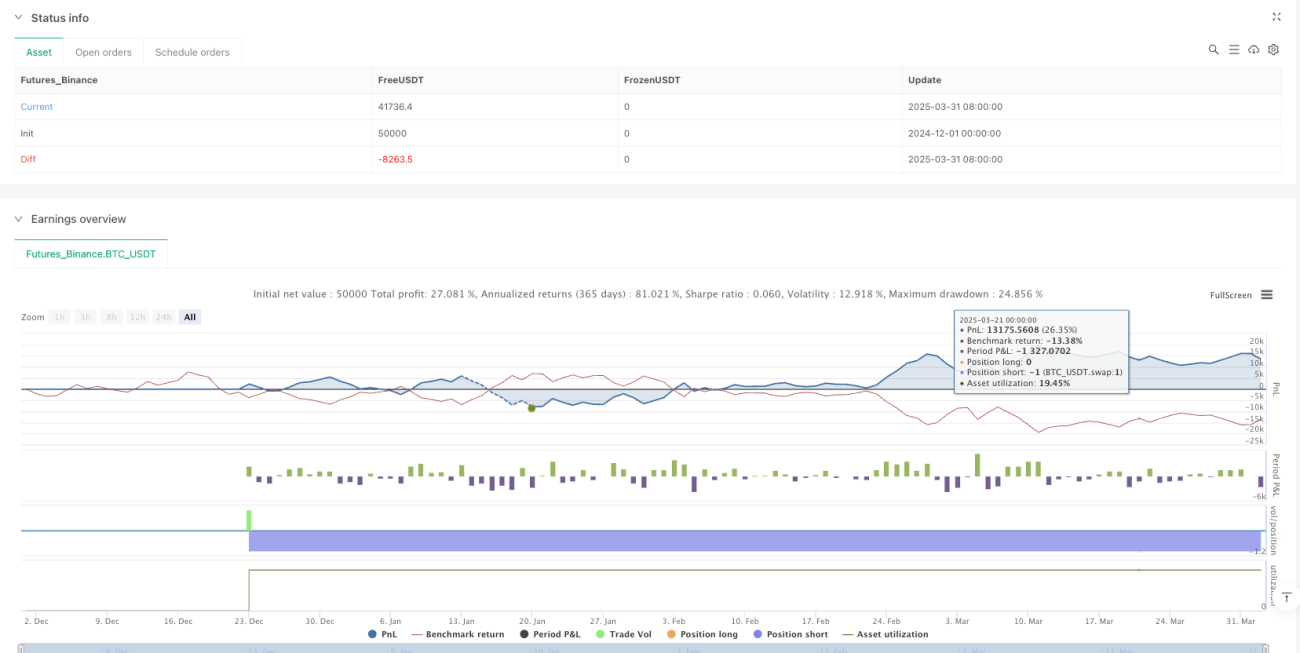
The EMA-Assisted Extreme Point Reversal Trading Strategy is a technical indicator-based reversal trading system that profits by capturing potential reversal points in overbought and oversold market conditions. The core logic combines CCI/Momentum indicator zero-line crossovers, RSI overbought/oversold zone confirmation, optional divergence verification, and a 100 EMA as a trend filter.
This strategy performs exceptionally well in range-bound market environments, particularly suited for Ethereum/Tether on a 5-minute timeframe. Its strengths lie in its multiple confirmation mechanisms and flexible parameter settings, but it also faces inherent risks of counter-trend trading and challenges from lacking a comprehensive stop loss mechanism.
To further enhance strategy performance, it is recommended to add appropriate stop loss and take profit rules, integrate multi-timeframe analysis, optimize entry logic, introduce volatility filters, and implement effective money management rules. With these optimizations, this strategy could become a valuable addition to a trader's toolkit, especially suitable for capturing short-term market reversal opportunities.
- 1