
Overview
The Multi-Filter Convergence Scalping Strategy is a precision-designed quantitative trading method created for traders who want to capture short-term price movements in fast-moving markets. This strategy identifies precise buy and sell opportunities by combining trend analysis, momentum indicators, volume, volatility, and candlestick patterns. This approach solves the problem of finding reliable entry and exit points in choppy or unpredictable markets, making it ideal for scalpers, while providing built-in risk management through stop-loss and take-profit settings.
Strategy Principles
The strategy employs a multi-filter mechanism where trading signals are generated only when all technical indicators simultaneously meet the conditions, ensuring high-probability trading opportunities. Specifically, the strategy uses the following five key components:
-
Trend Direction: A 50-period Simple Moving Average (SMA) acts as a trend filter. If the price is above this line, it indicates a bullish market suitable for buying; if below, it indicates a bearish market suitable for selling.
-
Momentum Indicator: The 14-period Relative Strength Index (RSI) measures the speed of price movements. It ensures the market isn't overbought (RSI < 70) for buys or oversold (RSI > 30) for sells.
-
Volume Analysis: The strategy compares current trading volume to a 20-period average volume to confirm strong market participation—only moves with above-average volume trigger signals.
-
Volatility: The 14-period Average True Range (ATR) checks if price swings are large enough (above a user-set minimum, default 2.0) to justify a trade.
-
Candlestick Patterns: Simple yet effective pattern recognition (e.g., a bullish candle closing higher than the previous day's close after opening lower) adds confirmation to signals.
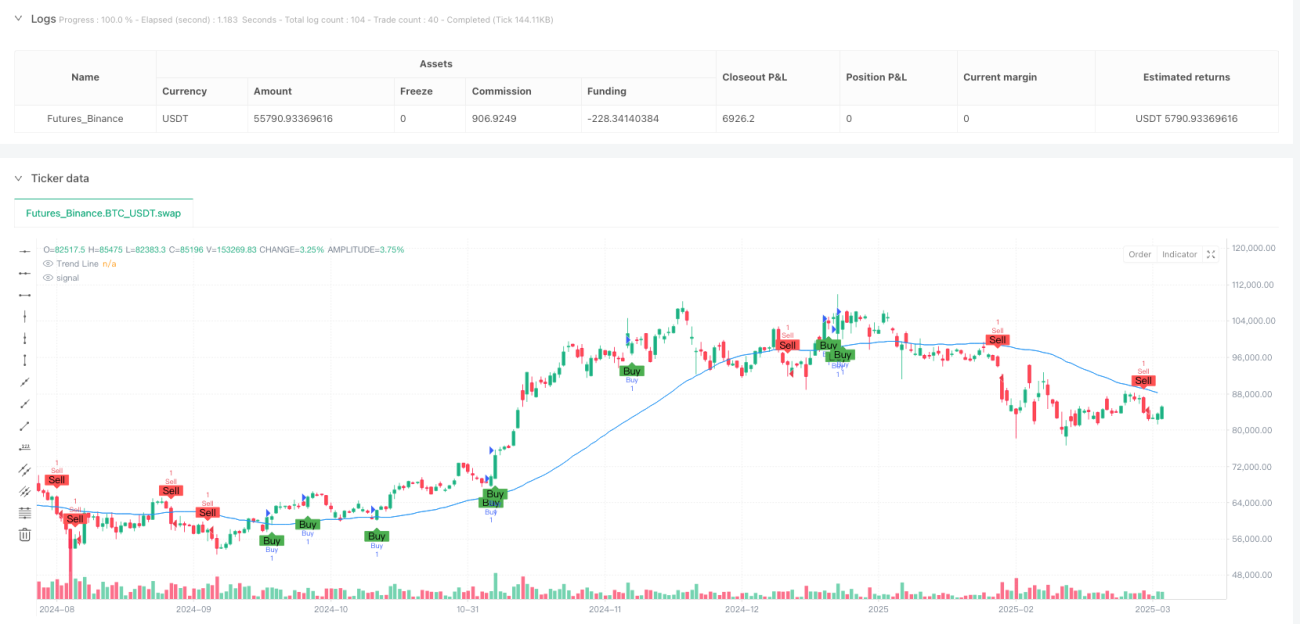
Buy or sell signals trigger only when all these conditions align, ensuring high-probability trades. Once a signal fires, the strategy automatically places orders with customizable stop-loss (e.g., 1% below entry) and take-profit (e.g., 2% above entry) levels.
Strategy Advantages
The Multi-Filter Convergence Scalping Strategy offers several distinct advantages:
-
Reduced False Signals: By requiring all five technical indicators to confirm simultaneously, the strategy greatly reduces the likelihood of false signals, improving the success rate of trades.
-
Comprehensive Market Analysis: By considering trend, momentum, volume, volatility, and price patterns simultaneously, the strategy provides a comprehensive analysis of market conditions rather than relying on a single indicator.
-
High Adaptability: The strategy's parameters can be adjusted for different market environments, making it applicable to various trading instruments and timeframes, whether in low or high volatility markets.
-
Built-in Risk Management: Automatic stop-loss and take-profit settings ensure that risk is controlled for each trade, helping traders maintain discipline and avoid emotional decision-making.
-
Hierarchical Technical Confirmation: The strategy provides multiple layers of technical confirmation, from long-term trends (SMA) to short-term price action (candlestick patterns), giving traders greater confidence in the reliability of signals.
-
Automation Potential: The strategy's clear rules and conditions make it easy to program and automate, reducing the need for human intervention, suitable for busy traders or those looking to reduce emotional influence.
Strategy Risks
Despite its sophisticated design, the Multi-Filter Convergence Strategy has some potential risks and limitations:
-
Missed Trading Opportunities: As the strategy requires all filters to confirm simultaneously, it may miss potentially profitable trading opportunities that satisfy only some conditions, especially in rapidly changing markets.
-
Parameter Optimization Needs: The strategy's effectiveness is highly dependent on selecting appropriate parameters for specific trading instruments and market conditions. Inappropriate parameter settings may lead to over-optimization or poor performance.
-
Limitations of Fixed Stop-Loss Percentages: Using fixed percentage stop-losses may not be suitable for all market environments, especially during periods of sudden volatility changes.
-
Volume Dependency: In less liquid markets or certain time periods, the high volume requirement may reduce signal frequency, limiting trading opportunities.
-
Technical Indicator Lag: All technical indicators have some degree of lag, which may result in slower reactions during extreme market conditions.
-
Pattern Limitations in Strong Trend Markets: In strongly trending markets, it may be difficult to satisfy specific candlestick pattern requirements, leading to missed trend-following opportunities.
To mitigate these risks, traders should consider thorough backtesting before live trading and adjusting parameters according to their risk tolerance.
Strategy Optimization Directions
Based on the analysis of strategy principles and potential risks, here are several possible optimization directions:
-
Adaptive Parameters: Convert fixed parameters (such as moving average length, RSI thresholds) to dynamic parameters that automatically adjust based on market conditions. For example, the ATR minimum value could automatically adjust based on historical volatility in different volatility environments.
-
Multi-Timeframe Analysis: Integrate confirmation signals from multiple timeframes, for instance, using larger timeframes to determine the main trend direction, then looking for specific entry points on smaller timeframes.
-
Improved Stop-Loss Strategy: Replace fixed percentage stop-losses with ATR-based stops to better accommodate the volatility characteristics of different trading instruments. For example, the stop-loss could be set at the entry point minus 1.5 times the current ATR value.
-
Add Market State Filters: Incorporate functionality to identify market states (such as range-bound or trending) in the algorithm and apply different trading rules based on different market states.
-
Signal Strength Grading: Instead of binary signals (buy/sell), grade signals based on the strength of conditions met, allowing for position sizing adjustments according to signal strength.
-
Machine Learning Integration: Use machine learning algorithms to optimize parameter combinations or predict which signals are more likely to succeed, particularly in identifying patterns in specific market environments.
These optimizations can be implemented individually or in combination to improve the overall performance and adaptability of the strategy. Before implementing any optimization, thorough backtesting under different market conditions is recommended.
Summary
The Multi-Filter Convergence Scalping Strategy provides scalpers with a comprehensive and powerful trading system by integrating multiple technical analysis methods. Its core strength lies in combining several independent technical indicators, generating trading signals only when all indicators consistently point in the same direction, significantly improving signal reliability.
The strategy's flexibility makes it applicable to various market environments and trading instruments, while its built-in risk management features help protect capital and maintain long-term profitability. Although there are some inherent limitations and risks, these can be effectively mitigated through continuous parameter optimization and the strategy improvements suggested above.
For traders seeking to apply a systematic and disciplined approach to scalping, the Multi-Filter Convergence Strategy provides a solid framework that considers both technical aspects of the market and risk control, representing a comprehensive and balanced approach in the field of quantitative trading.
- 1