
Overview
The Dynamic EMA Crossover with RSI Trend Confirmation Quantitative Trading Strategy is a technical analysis trading system that combines Exponential Moving Averages (EMA) and the Relative Strength Index (RSI). This strategy utilizes crossover signals between short-term and long-term moving averages to determine market trend direction, while using the RSI indicator for trend confirmation and filtering, effectively reducing false signals. Additionally, the strategy incorporates risk management mechanisms through predefined stop-loss and take-profit targets to protect trading capital and optimize the risk-reward ratio. This strategy is applicable to various trading instruments and timeframes, providing traders with a systematic approach to trading.
Strategy Principles
The core principles of this strategy are based on the synergistic effect of two main technical indicators:
-
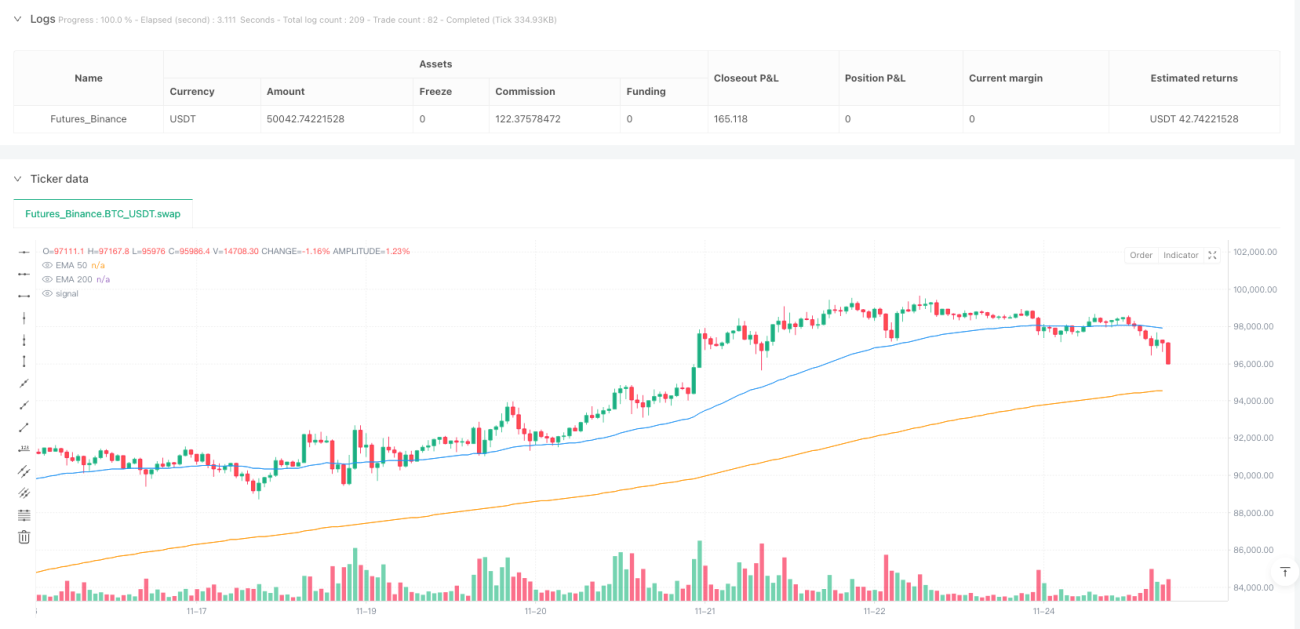
Exponential Moving Average (EMA) Crossover System:
- Short-term EMA default is 50 periods
- Long-term EMA default is 200 periods
- When the short-term EMA crosses above the long-term EMA, a bullish signal is generated
- When the short-term EMA crosses below the long-term EMA, a bearish signal is generated
-
Relative Strength Index (RSI) Trend Confirmation:
- RSI default setting is 14 periods
- Buy conditions require RSI greater than 50, confirming uptrend strength
- Sell conditions require RSI less than 50, confirming downtrend strength
- Overbought level is set at 70, oversold level is set at 30
-
Timeframe Filtering:
- Strategy is only valid in specific timeframes: 15 minutes, 1 hour, 4 hours, and daily
- By limiting applicable timeframes, the strategy avoids generating erroneous signals in extremely short periods with high noise or extremely long periods with lower liquidity
-
Risk Management System:
- User-definable stop-loss levels (in points)
- Take-profit targets based on a multiple of the stop-loss, default is 2 times the stop-loss
- Automatic setting of stop-loss and take-profit after entry, requiring no manual adjustment
Strategy Advantages
After in-depth analysis, this strategy shows the following significant advantages:
-
Trend Following and Momentum Combination: EMA crossovers provide trend direction, while RSI ensures trades are only taken when the trend is established, effectively balancing trend following with momentum confirmation.
-
Strong Adaptability: Through parameter settings, the strategy can be optimized for different market environments and trading instruments, adapting to different volatility characteristics.
-
Clear Risk Control: Predefined stop-loss and take-profit targets ensure consistent risk-reward ratios for each trade, helping traders maintain discipline.
-
Multi-timeframe Applicability: The strategy can run on different timeframes, from short-term 15-minute to long-term daily charts, offering choices for investors with different trading styles.
-
Clear Visual Signals: The strategy displays trading signals through clear markings on the chart (📈 buy and 📉 sell), allowing traders to quickly identify opportunities.
-
Clear Code Structure: The strategy code is well-organized, with clear logic and flexible parameter settings, facilitating further customization and optimization.
-
Strict Entry Conditions: By combining two different types of technical indicators (trend and momentum), the strategy reduces false signals that might arise from using a single indicator.
Strategy Risks
Despite its many advantages, the strategy still has the following potential risks:
-
Lag Risk: EMAs are inherently lagging indicators, which may lead to delayed entries or exits in rapidly changing markets, missing optimal price points.
-
Poor Performance in Ranging Markets: In markets without clear trends, EMA crossovers may generate frequent false signals, leading to consecutive losses.
-
Parameter Sensitivity: Strategy performance is highly dependent on EMA and RSI parameter settings; inappropriate parameters may lead to over-optimization or inability to adapt to market changes.
-
Gap Risk: Fixed stop-losses cannot account for market gaps, potentially resulting in actual losses exceeding expected stop-loss levels.
-
Lack of Fundamental Considerations: The strategy is entirely based on technical indicators, disregarding fundamental factors, which may generate incorrect signals during major news or economic data releases.
Risk mitigation measures:
- Consider pausing the strategy or widening stop-loss ranges before major economic events
- Consider adding volatility filters to pause trading during abnormal market conditions
- Incorporate additional indicators for trade confirmation, such as volume or other oscillators
- Regularly re-optimize parameters to adapt to changing market conditions
Strategy Optimization Directions
Based on code analysis, the strategy can be optimized in the following directions:
-
Dynamic Risk Management:
- The current strategy uses fixed points for stop-loss; this could be changed to ATR-based (Average True Range) dynamic stop-losses to better adapt to different market volatilities
- Implementation:
stop_loss = close - (ta.atr(14) * 1.5)
-
Trend Strength Filtering:
- Add trend strength filters, such as the ADX indicator, to only trade in clearly defined trends
- Example:
strong_trend = ta.adx(14) > 25
-
Multi-timeframe Analysis:
- Implement higher timeframe trend confirmation combined with lower timeframe signal generation
- Higher timeframe trend states can be obtained through the
request.securityfunction
-
Entry Timing Optimization:
- Add candlestick pattern confirmation to EMA crossovers
- Consider entering only when price pulls back near the EMA, rather than directly at the crossover point
-
Improved Money Management:
- The current strategy uses fixed proportion (10%) money management; this could be implemented as volatility-based position sizing
- Reduce position sizes in high volatility markets and increase them in low volatility markets
-
Machine Learning Integration:
- Long-term optimization could consider incorporating machine learning algorithms to dynamically optimize EMA and RSI parameters
- Train models using historical data to predict optimal parameter combinations
-
Sentiment Indicator Integration:
- Consider adding market sentiment indicators, such as VIX or volume change rates
- Adjust strategy behavior during extreme sentiment market conditions
Conclusion
The Dynamic EMA Crossover with RSI Trend Confirmation Quantitative Trading Strategy is a clearly structured, logically rigorous technical analysis trading system. By combining the trend-following characteristics of EMAs with the momentum confirmation capabilities of RSI, this strategy can effectively identify market trends and execute trades at appropriate times. The built-in risk management mechanisms give the strategy good risk control capabilities, suitable for traders with different risk preferences.
The strategy's multi-timeframe adaptability makes it applicable to different trading styles, from day trading to swing trading to long-term investment. Through the optimization directions proposed in this article, especially dynamic risk management and multiple confirmation mechanisms, this strategy can further enhance its robustness and adaptability.
However, traders should be mindful of changing market environments when using this strategy, particularly in low-volatility and ranging markets where parameter adjustments or temporary strategy deactivation may be necessary. No strategy performs excellently in all market environments, so combining personal trading style and risk management principles when using and optimizing this strategy is crucial.
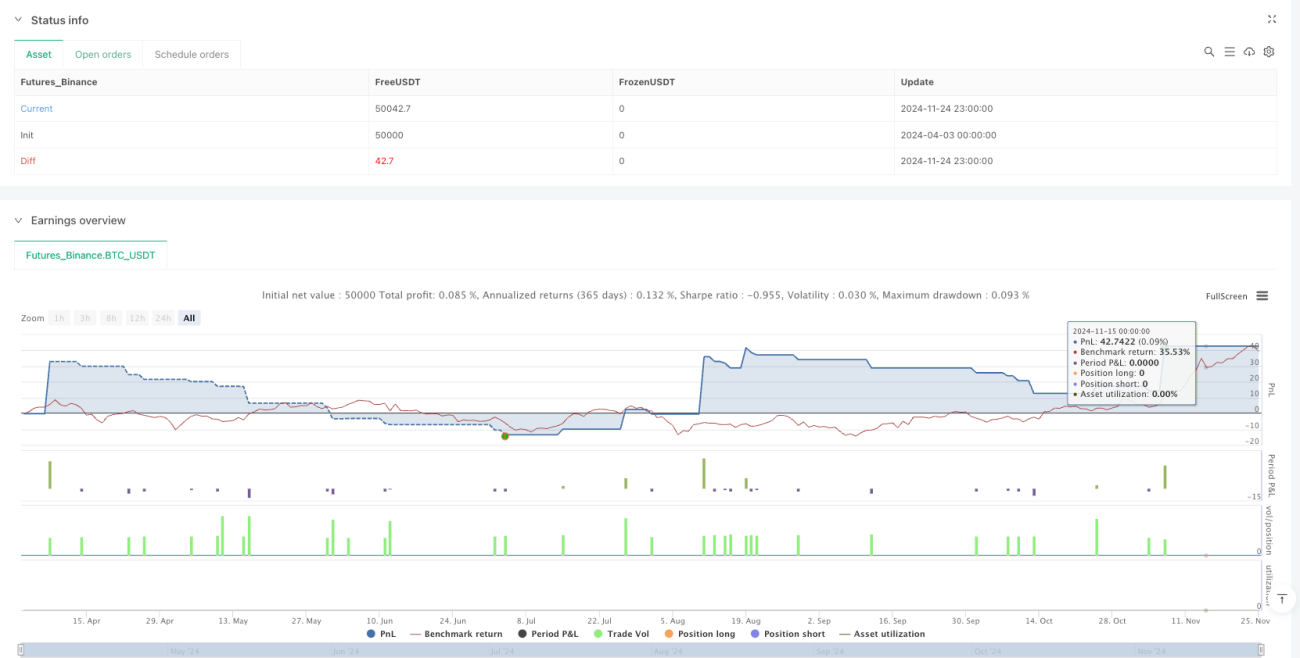
/*backtest
start: 2024-04-03 00:00:00
end: 2024-11-25 00:00:00
period: 1h
basePeriod: 1h
exchanges: [{"eid":"Futures_Binance","currency":"BTC_USDT"}]
*/

//@version=5
strategy("Estrategia EMA + RSI", overlay=true, default_qty_type=strategy.percent_of_equity, default_qty_value=10)

// Parámetros configurables para las EMAs y el RSI- 1