Overview
This strategy is a quantitative trading system based on price action analysis, focusing on capturing key market reversals and breakout signals. The strategy combines multiple price pattern recognition techniques, including pin bar reversal formation identification and price breakout confirmation, while integrating risk management mechanisms and trading time filtering functions to improve win rate and overall performance.
Strategy Principles
The core principles of this strategy are based on two main price action signals: pin bar reversal patterns and price breakouts.
Pin Bar Reversal Detection: - Bullish Pin Bar: Close price is higher than open price, and the upper shadow length exceeds twice the body length, indicating selling pressure at highs being taken over by buyers - Bearish Pin Bar: Open price is higher than close price, and the lower shadow length exceeds twice the body length, indicating buying support at lows being broken by sellers
Price Breakout Confirmation: - Bullish Breakout: Current close price is higher than the highest close price of the previous 5 periods, indicating an uptrend formation - Bearish Breakout: Current close price is lower than the lowest close price of the previous 5 periods, indicating a downtrend formation
Trade Execution Logic: 1. The system checks time filtering conditions to avoid periods when important economic news might be released 2. Evaluates whether valid bullish or bearish signals exist 3. Sets take profit and stop loss based on defined risk-reward ratio and stop loss points 4. Optional trailing stop can be enabled to protect realized profits
This approach combines price reversal signals and trend confirmation, improving signal reliability by requiring at least one of the two conditions to be met.
Strategy Advantages
Multi-dimensional Signal Confirmation: By combining two different types of price action signals - pin bar reversals and price breakouts - the strategy can verify trading opportunities from multiple angles, reducing the risk of false signals.
Flexible Risk Management: The strategy allows for parameterized settings to adjust risk-reward ratios and stop loss points, enabling traders to customize risk control measures according to personal risk tolerance and market conditions.
Adaptive Protection Mechanism: The optional trailing stop feature automatically adjusts the stop loss position as the price moves in a favorable direction, locking in partial profits while giving the price sufficient room to fluctuate.
Time Filtering Functionality: By avoiding trading during periods when important economic data might be released, the strategy reduces the risk of market volatility caused by sudden news, which is particularly important for lower timeframe trading.
Position Management Integration: The system uses account equity percentage to automatically calculate position size, ensuring risk exposure maintains appropriate proportion to account size, automatically adjusting as the account grows or shrinks.
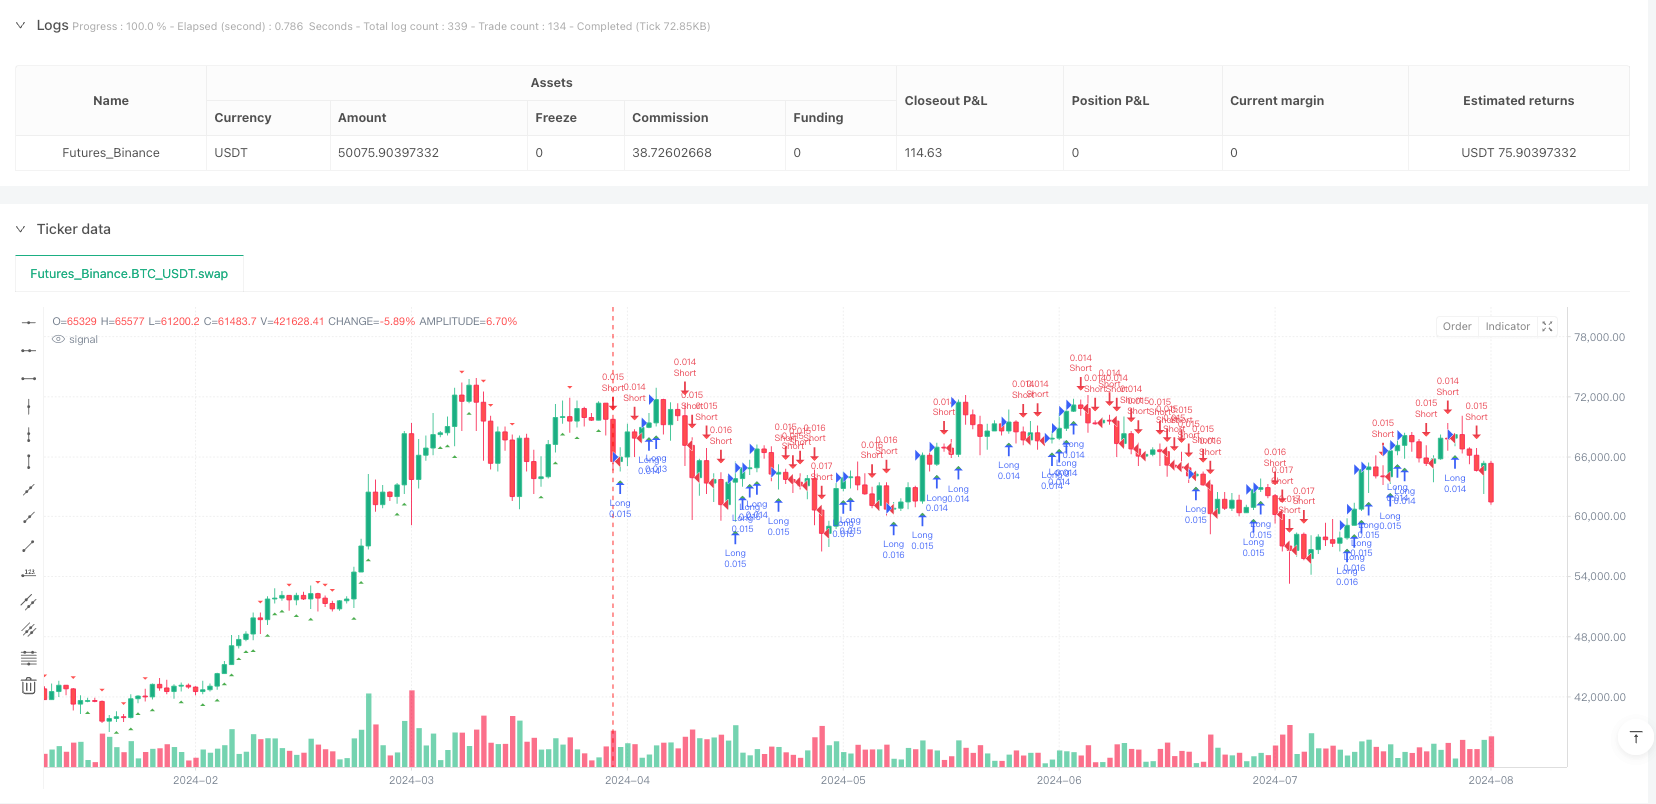
Visualization of Trading Signals: By visually displaying buy and sell signals on the chart, the strategy helps traders better understand and evaluate the trading decisions generated by the system.
Strategy Risks
Reversal Signal Reliability: Pin bar reversal patterns may produce false signals under certain market conditions, especially in high volatility or ranging markets. To reduce this risk, consider adding auxiliary confirmation indicators such as volume or momentum indicators.
Post-Breakout Pullback Risk: Price often experiences pullbacks after breakouts, which may trigger stop losses before the market returns to the expected direction. Solutions include considering wider stop loss settings or implementing a scaled entry strategy.
Time Filtering Limitations: The current time filtering mechanism is based on fixed time periods and cannot dynamically adapt to sudden news events. It’s recommended to integrate a more comprehensive economic calendar API for real-time news impact assessment.
Parameter Optimization Risk: Strategy performance highly depends on key parameters such as risk-reward ratio and stop loss settings. Over-optimization of these parameters may lead to good backtest performance but poor live trading results. Parameter settings should be validated through robustness testing under different market conditions.
Lack of Market State Adaptability: The strategy may perform well in trending markets but may produce too many false signals in range-bound markets. A trend strength filter can be added to avoid trading in inefficient market environments.
Strategy Optimization Directions
Integrate Market State Analysis: Introduce trend strength indicators (such as ADX) and volatility indicators (such as ATR) to help the strategy identify the current market environment and only execute trades when market conditions are suitable for the strategy logic. This will significantly reduce false signals under non-ideal conditions.
Dynamic Stop Loss Optimization: The current strategy uses fixed stop loss points, which could be improved to automatically adjust stop loss distance based on market volatility (such as ATR multiples), making stop loss settings more adaptive to current market conditions.
Add Volume Confirmation: Price action signals combined with volume confirmation can significantly improve reliability. Add conditions requiring volume to be above average level when signals form to ensure sufficient market participation supporting price movements.
Multi-timeframe Analysis: By introducing trend direction analysis from higher timeframes to ensure trade direction aligns with the larger trend, the overall win rate and risk-reward ratio of the strategy can be improved.
Optimize News Filtering Mechanism: Upgrade the existing simple time-based filtering to integration with an economic calendar API to dynamically identify high-impact news events and automatically disable trading during relevant periods.
Introduce Machine Learning Classification: By using machine learning algorithms to classify historical signals, identify pattern features with higher success probabilities, and enhance signal filtering conditions with these features to improve the predictive accuracy of the strategy.
Conclusion
This advanced price action strategy builds a relatively robust trading system by combining pin bar reversal pattern recognition and price breakout confirmation. Its built-in risk management mechanisms, trading time filtering, and position control functions together form a comprehensive trading framework.
The main advantages of the strategy lie in its multi-dimensional signal confirmation method and flexible risk control mechanisms, which enable it to adapt to different market environments. However, risk factors such as pin bar pattern reliability and post-breakout pullbacks need attention and can be improved through the suggested optimization directions.
By integrating market state analysis, dynamic stop loss, volume confirmation, multi-timeframe analysis, and more precise news filtering functionality, the strategy is expected to achieve more stable performance across different market cycles. Ultimately, this price action-based approach provides traders with a reliable framework to capture potential trading opportunities through timely identification of key market turning points.
/*backtest
start: 2024-04-03 00:00:00
end: 2024-08-03 00:00:00
period: 1d
basePeriod: 1d
exchanges: [{"eid":"Futures_Binance","currency":"BTC_USDT"}]
*/

// Pine Script v5 – Price Action Trading Bot for EUR/USD on 15m timeframe
//@version=5
strategy("Price Action Bot - EUR/USD", overlay=true, default_qty_type=strategy.percent_of_equity, default_qty_value=2)

// === INPUTS ===
riskRewardRatio = input.float(3.0, "Risk/Reward Ratio", minval=1.0)
stopLossPips = input.float(10, "Stop Loss (pips)", minval=1)
trailingStop = input.bool(true, "Enable Trailing Stop")
newsFilter = input.bool(true, "Disable Trading During High Impact News")

// === TIME FILTER FOR NEWS ===
// Placeholder for news filter logic (needs manual adjustment or external integration)
allowTrade = hour != 13 and hour != 14  // Avoiding possible news hours (example: 13:00–14:59 UTC)

// === PRICE ACTION SIGNALS ===
bullishPinBar = close > open and (high - close) > 2 * (close - open)
bearishPinBar = open > close and (close - low) > 2 * (open - close)

bullBreakout = close > ta.highest(close[1], 5)
bearBreakout = close < ta.lowest(close[1], 5)

// === ENTRY CONDITIONS ===
longCondition = allowTrade and (bullishPinBar or bullBreakout)
shortCondition = allowTrade and (bearishPinBar or bearBreakout)

// === TRADE EXECUTION ===
pip = syminfo.mintick * 10
sl = stopLossPips * pip

if (longCondition)
    strategy.entry("Long", strategy.long)
    strategy.exit("TP/SL", "Long", stop=close - sl, limit=close + (sl * riskRewardRatio), trail_points=trailingStop ? sl/2 : na)

if (shortCondition)
    strategy.entry("Short", strategy.short)
    strategy.exit("TP/SL", "Short", stop=close + sl, limit=close - (sl * riskRewardRatio), trail_points=trailingStop ? sl/2 : na)

// === PLOT SIGNALS ===
plotshape(longCondition, location=location.belowbar, color=color.green, style=shape.triangleup, title="Buy Signal")
plotshape(shortCondition, location=location.abovebar, color=color.red, style=shape.triangledown, title="Sell Signal")