Overview
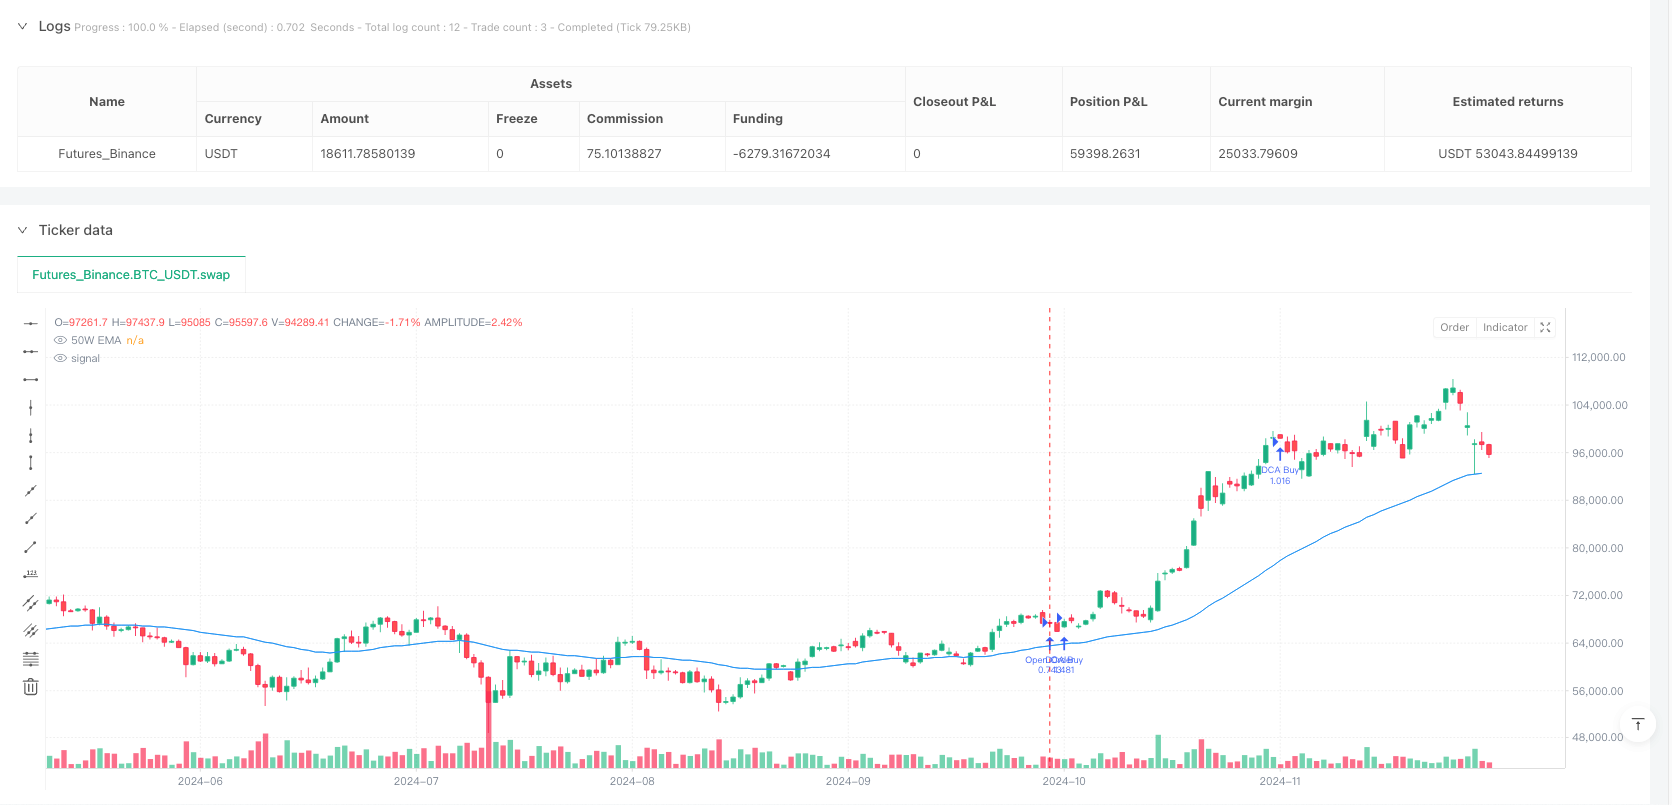
This strategy ingeniously combines trend-following principles with dollar-cost averaging (DCA) methodology, aiming to efficiently deploy capital while minimizing market timing risk. The strategy primarily uses the 50-period Exponential Moving Average (EMA) as an indicator for market trend determination, and accumulates funds through monthly fixed investments. When the price is below the 50-period EMA, the strategy adds a fixed amount to a cash reserve each month; once the price breaks above the 50-period EMA, the strategy immediately invests all accumulated funds into the market and continues executing monthly investments during the holding period. If the price falls back below the 50-period EMA, the strategy closes all positions and restarts the cash accumulation process.
Strategy Principles
The core principle of this strategy is combining technical analysis trend signals with systematic capital management methods. The specific implementation mechanics are as follows:
Trend Determination Mechanism: Uses the 50-period EMA as an indicator for medium to long-term trends. When the price is above the EMA, it’s considered an uptrend; when the price drops below the EMA, it’s considered a downtrend.
Capital Accumulation Phase: When the price is below the 50-period EMA (long condition not met), the strategy doesn’t take market positions but instead adds a fixed amount (parameter set to 100,000 currency units) to a cash reserve monthly. This ensures continuous capital accumulation during unfavorable market conditions.
Capital Deployment Phase: When the price breaks above the 50-period EMA (long condition met), the strategy:
- Establishes a long position using the entire capital (including accumulated cash reserves) if there are no current positions
- Resets the cash reserve to 0
- Continues making fixed monthly investments during the holding period
Exit Mechanism: Once the price falls below the 50-period EMA, the strategy closes all positions and restarts the cash reserve accumulation process.
From the code implementation, the strategy uses the cash_reserve variable to track accumulated cash, uses the time_since_last_investment variable to ensure the investment interval is accurately controlled at approximately one month (30 days), and implements a complete exit mechanism through the strategy.close_all() function.
Strategy Advantages
After in-depth code analysis, this strategy demonstrates the following significant advantages:
Systematic Investment Method: The strategy completely eliminates emotional decision-making, ensuring capital is systematically deployed under any market conditions through preset rules. This avoids delays or hesitation caused by human judgment.
Maximized Capital Efficiency: By accumulating funds during unfavorable conditions and deploying all accumulated capital at once when favorable conditions appear, the strategy maximizes capital utilization efficiency. This approach both avoids premature investment in downtrends and ensures full participation in uptrends.
Balanced Risk and Reward: The dual mechanism combining trend following and DCA protects capital safety while not missing important market upside opportunities. The trend-following component controls overall risk, while the DCA component ensures continuous market participation.
Strong Adaptability: Strategy parameters can be adjusted according to different market conditions and investor risk preferences. Both the EMA period and investment amount are adjustable parameters, enhancing the strategy’s flexibility.
Long-term Compounding Effect: By combining monthly investments with trend determination, the strategy can achieve compound growth in long-term markets, showing resilience especially in environments with alternating market cycles.
Simple and Clear Execution: Despite the advanced strategy concept, its execution rules are simple and clear, reducing operational complexity and potential execution errors.
Strategy Risks
Despite the strategy’s careful design, the following potential risks exist:
Lag Risk: EMA is a lagging indicator, which may lead to less-than-ideal entry and exit timing at trend turning points. Especially in rapidly changing markets, it may lead to significant drawdowns before triggering exit signals.
Poor Performance in Ranging Markets: In sideways, oscillating markets, prices may frequently cross the EMA, resulting in multiple entries and exits, increasing transaction costs and potentially causing “whipsaw” losses.
Capital Management Challenges: Fixed investment amounts may not be suitable for all market phases, and a more flexible capital allocation strategy may be needed in highly volatile environments.
Cycle Dependency: The strategy heavily depends on the chosen EMA period (50 in this case), and different period settings will produce drastically different results, making it difficult to determine optimal parameters.
Execution Slippage Impact: The code sets 1 point slippage, but in actual trading, especially in markets with insufficient liquidity, execution slippage may be far greater than the preset value, affecting strategy performance.
Methods to mitigate these risks include: adding filter indicators to reduce false signals; implementing dynamic stop-loss mechanisms; introducing volatility-adjusted capital management; using multi-period confirmation signals; and conducting extensive backtesting and parameter optimization across different market environments.
Strategy Optimization Directions
Based on in-depth code analysis, the strategy can be optimized in the following directions:
Multi-indicator Confirmation Mechanism: Introduce additional technical indicators (such as RSI, MACD, or volume) as confirmation signals to reduce false signals generated by EMA crossovers. This can improve signal quality and reduce unnecessary trades.
Dynamic Capital Management: Link the investment amount to market volatility or trend strength, increasing investment in high-certainty environments and reducing it in highly uncertain environments. For example, the investment amount could be adjusted based on ATR (Average True Range).
Partial Position Management: Implement mechanisms for staged position building and reduction rather than all-or-nothing operations, which can reduce timing pressure and provide a smoother equity curve.
Adaptive EMA Period: Change the fixed 50-period EMA to an adaptive moving average that automatically adjusts based on market conditions, better adapting to different market phases and cycles.
Improved Stop-Loss Mechanism: Add trailing stops or volatility-based stop-loss mechanisms rather than relying solely on EMA crossover exits, which can protect capital earlier during significant drawdowns.
Time Filter: Add trading time filters to avoid operations during known inefficient trading sessions, or adjust strategy parameters within specific seasonal patterns.
Backtesting Optimization Framework: Implement a parameter optimization framework that automatically finds optimal parameter combinations under different market conditions and conducts forward validation to ensure parameter robustness.
The common goal of these optimization directions is to improve the strategy’s win rate, reduce drawdowns, and make capital management more flexible and efficient, thereby enhancing its adaptability and robustness across various market environments while maintaining the core logic of the original strategy.
Summary
The “50-Period EMA Crossover with Monthly Dollar-Cost Averaging Dual-Optimization Trend Following Strategy” represents a balanced, systematic quantitative trading approach that cleverly integrates technical analysis trend determination with traditional dollar-cost averaging investment principles. By accumulating funds during downtrends and deploying them fully when uptrends are established, the strategy achieves optimal capital efficiency and risk control.
Despite inherent risks such as EMA indicator lag and poor performance in ranging markets, these drawbacks can be effectively mitigated through measures like multi-indicator confirmation, optimized capital management methods, and improved stop-loss mechanisms. Particularly noteworthy is the strategy’s flexibility and customizability, making it applicable to various market environments and investment styles.
From a long-term investment perspective, this strategy combining DCA with trend following is especially suitable for investors who wish to seek optimized market entry timing while maintaining systematic investment discipline. By reducing exposure during unfavorable trends and fully participating in uptrends, the strategy is likely to achieve a more balanced risk-reward profile over long-term market cycles than either pure DCA or trend following alone.
Whether for individual investors or professional traders, this strategy provides a reliable framework for making more systematic and objective investment decisions in complex and changing market environments.
/*backtest
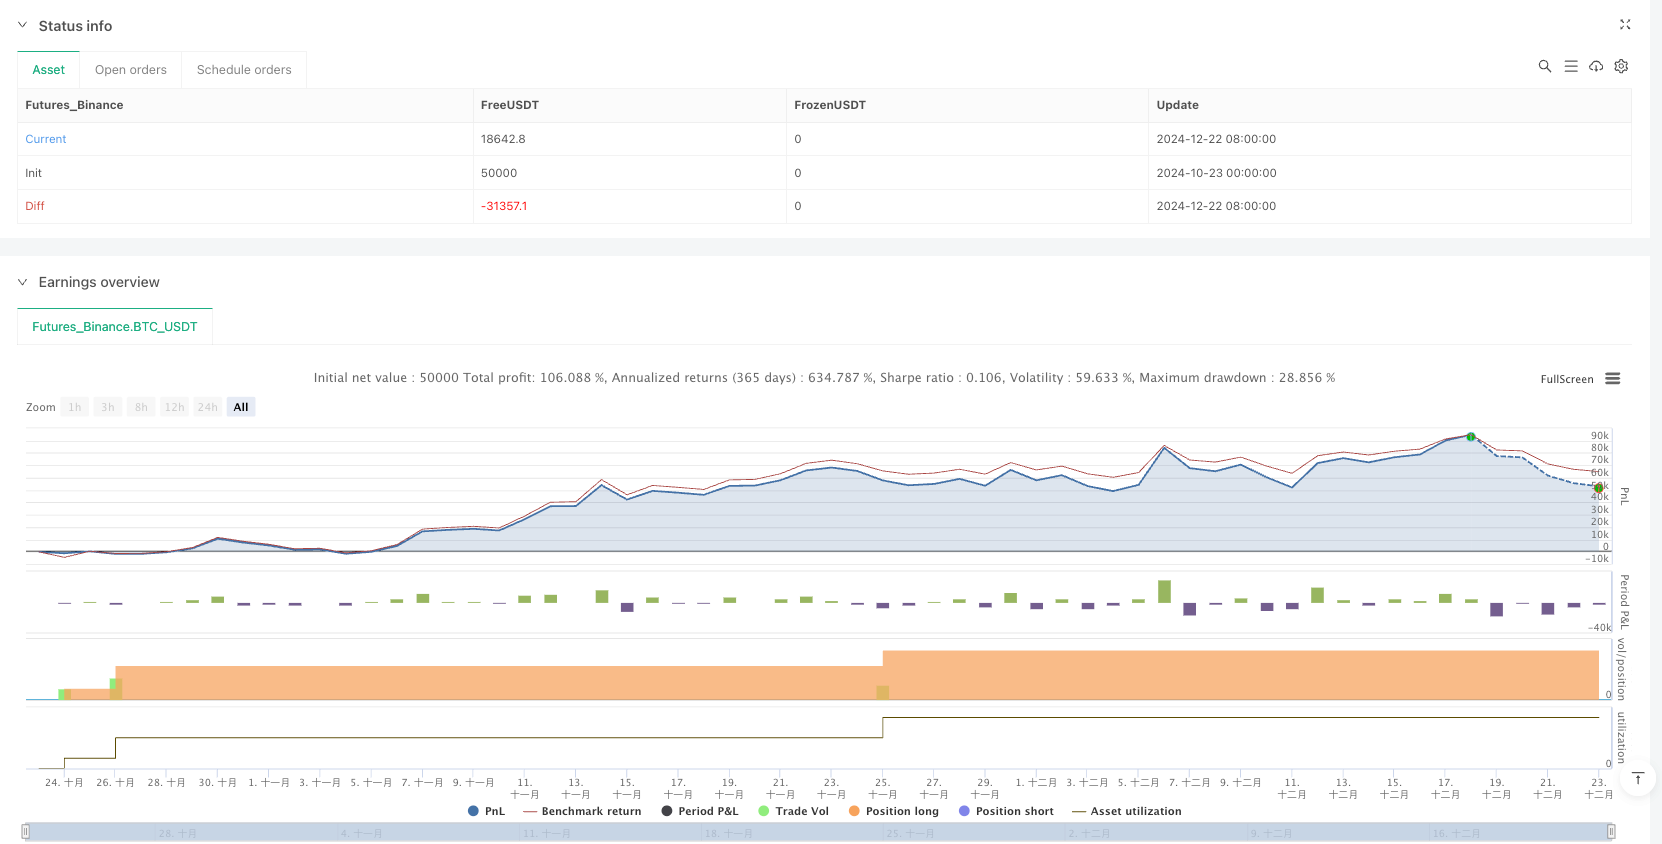
start: 2024-10-23 00:00:00
end: 2024-12-23 00:00:00
period: 1d
basePeriod: 1d
exchanges: [{"eid":"Futures_Binance","currency":"BTC_USDT"}]
*/
//@version=5
//CELIA IS EEN KLEINE VIS
strategy("50 EMA Crossover With Monthly DCA", overlay=true, initial_capital=100000, slippage=1, default_qty_type=strategy.cash, process_orders_on_close=true)
// === Parameters ===
dca_amount = input.int(100000, title="DCA Investment Amount ($)", minval=1) // Monthly DCA amount
//ema_length = input.int(50, title="EMA Length", minval=1) // EMA length
emaValue = ta.ema(close, 50)
plot(emaValue, color=color.blue, title="50W EMA")
// === Tracking Variables ===
var float cash_reserve = 0 // To track the accumulated cash
var float total_invested = 0 // To track the total amount invested (cash + DCA)
var float last_investment_time = na
month_seconds = 30 * 24 * 60 * 60 // Approx 1 month in seconds
// === Time Check: Has 1 Month Passed? ===
time_since_last_investment = na(last_investment_time) ? month_seconds : (time - last_investment_time) / 1000
// === Strategy Conditions ===
longCondition = close > emaValue // Buy when close is above the 50-week EMA
if longCondition
if strategy.opentrades == 0 // No open positions
// Invest full capital (equity + cash), including DCA saved
strategy.order("Open Order", strategy.long, qty = (strategy.equity+cash_reserve) / close)
cash_reserve := 0 // Reset cash reserve after full reinvestment
if time_since_last_investment >= month_seconds
// Accumulate DCA buy orders
strategy.order("DCA Buy", strategy.long, qty = dca_amount / close)
last_investment_time := time // Update the time of the last investment
// Accumulate DCA amount into cash reserve every month, regardless of long condition
if time_since_last_investment >= month_seconds
last_investment_time := time
// === Exit Strategy ===
exitCondition = close < emaValue // Exit if the price crosses below the 50-week EMA
if exitCondition
strategy.close_all() // Close the position when price crosses below the EMA
//plot(strategy.equity, style = plot.style_line, title = "Equity")
//plot(cash_reserve, style = plot.style_line, title = "DCA")
// Place the text below the current bar
var label myLabel = na
if (na(myLabel))
myLabel := label.new(bar_index, low - 0.02, "Celia is een kleine vis", color=color.white, textcolor=color.black, style=label.style_label_up, size=size.normal)
// Update the position of the label each bar
label.set_xy(myLabel, bar_index, low - 200)