
Overview
The Dynamic Volatility-Adaptive EMA-RSI Crossover Strategy is a quantitative trading system that integrates technical analysis with comprehensive risk management. This strategy primarily relies on EMA crossover signals, filtered by RSI confirmation, and dynamically adjusts stop-loss and take-profit levels using ATR-based volatility measurements. What distinguishes this strategy is its focus not only on entry timing but also on position sizing based on market volatility, coupled with an automatic position closing mechanism when trend reversals occur, forming a complete trading loop system.
Strategy Principles
This strategy employs multiple technical indicators to determine market trends and entry points, with the following specific logic:
-
Trend Identification and Entry Signals:
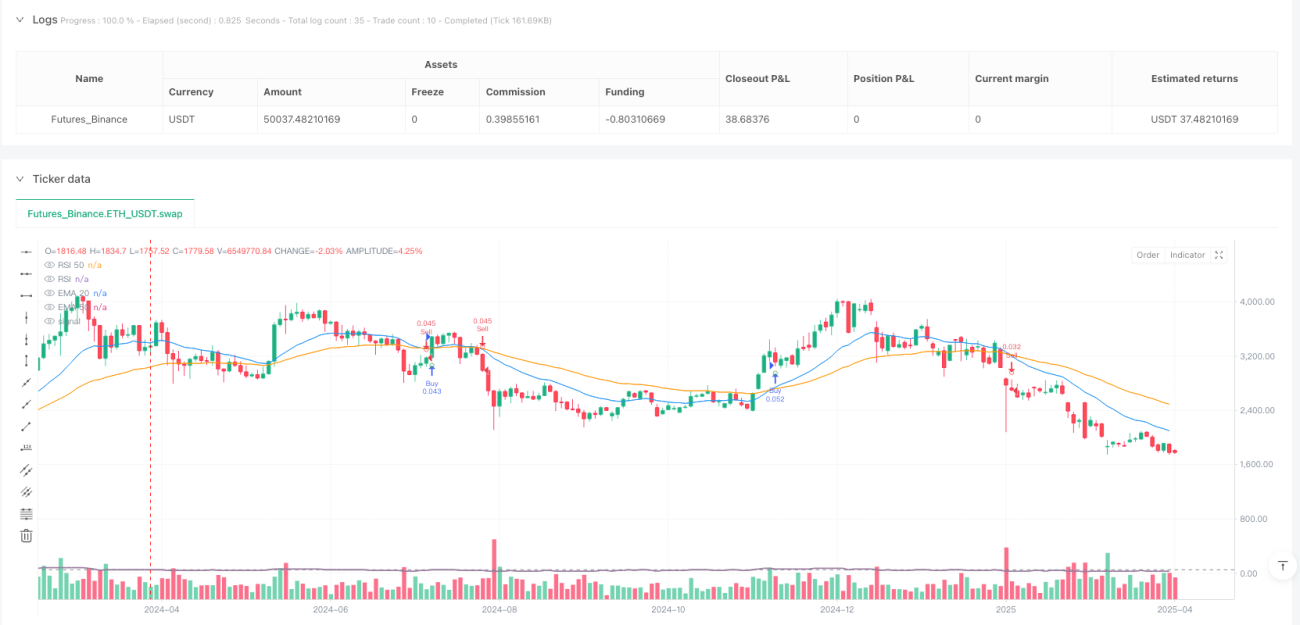
- Uses crossovers between 20-period and 50-period Exponential Moving Averages (EMA) as base signals
- When the short-term EMA(20) crosses above the long-term EMA(50) and the closing price is above EMA(50), a potential buy signal is generated
- When the short-term EMA(20) crosses below the long-term EMA(50) and the closing price is below EMA(50), a potential sell signal is generated
-
RSI Filtering Confirmation:
- Uses 14-period RSI as a signal filter
- Buy signals require RSI below 70 (not in overbought territory)
- Sell signals require RSI above 30 (not in oversold territory)
-
Risk Management Mechanism:
- Calculates market volatility based on 14-period ATR
- Stop-loss distance = ATR × Stop-loss multiplier (default 1)
- Take-profit distance = ATR × Take-profit multiplier (default 2)
- Risk amount = Total capital × Per-trade risk percentage (default 1%)
- Position size = Risk amount ÷ Stop-loss distance
-
Trend Reversal Closing:
- Automatically closes positions when opposite signals occur, without waiting for stop-loss or take-profit triggers
- Buy positions are closed when confirmed sell signals appear
- Sell positions are closed when confirmed buy signals appear
Strategy Advantages
Analyzing this strategy code reveals the following significant advantages:
-
Dynamic Risk Management: The strategy doesn't use fixed stop-loss points but adapts stop-loss distances to market volatility through ATR, ensuring stop-loss settings are neither too tight to be triggered by market noise nor too loose to cause excessive per-trade losses.
-
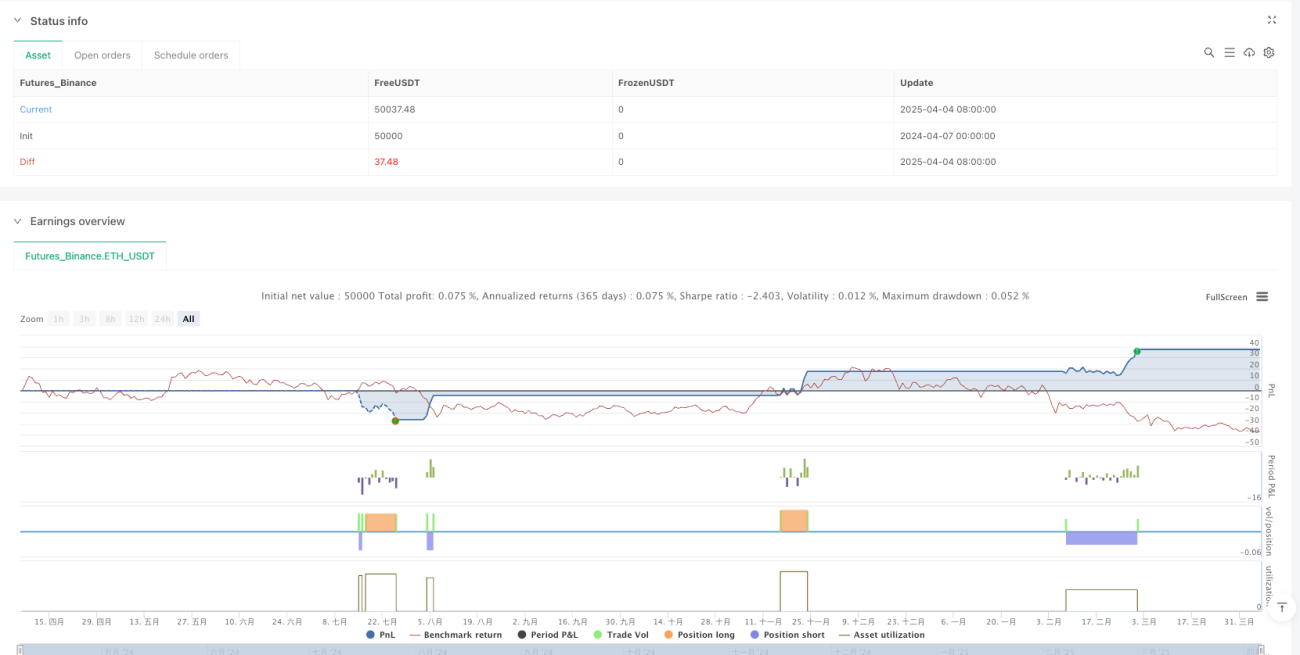
Proportional Risk Allocation: By precisely calculating the risk proportion for each trade, it ensures single-trade losses are controlled within a preset percentage of total capital (default 1%), effectively preventing account blowout risk.
-
Trend Following and Adaptability: By combining EMA crossovers with RSI filtering, the strategy can both follow major trends and avoid counter-trend trades in overbought or oversold areas, improving signal quality.
-
Optimized Risk-Reward Ratio: The default setting makes take-profit distance twice the stop-loss distance, ensuring a favorable risk-reward ratio, which is crucial for long-term stable profitability.
-
Trend Reversal Protection: The automatic position closing mechanism when trends reverse helps secure profits or reduce losses promptly, preventing positions from facing significant drawdowns.
Strategy Risks
Despite its comprehensive design, the strategy still has these potential risks:
-
False Breakout Risk: EMA crossovers may generate false breakout signals, especially in ranging markets. Solution: Consider adding volume confirmation or additional filtering conditions, such as using the ADX trend strength indicator.
-
Slippage and Spread Impact: The strategy doesn't account for slippage and spread factors in actual trading, which may cause actual execution results to deviate from backtesting results. Solution: Adjust stop-loss and take-profit distances when deploying in real markets, allowing for slippage.
-
Parameter Sensitivity: Strategy performance is sensitive to parameter settings such as EMA periods, RSI thresholds, and ATR multipliers. Solution: Conduct comprehensive parameter optimization and robustness testing to ensure parameters aren't overfitted to historical data.
-
Frequent Trend Changes: In choppy markets, EMAs may cross frequently, leading to overtrading and commission erosion. Solution: Add trend duration filtering conditions or adjust to longer-period EMA parameters.
-
Capital Management Risk: Though the strategy has built-in capital management mechanisms, it doesn't consider the scenario of correlated assets losing simultaneously. Solution: Implement portfolio risk management to control the overall risk exposure of correlated assets.
Strategy Optimization Directions
Based on code analysis, the strategy has several viable optimization directions:
-
Add Trend Strength Filtering: Introduce the ADX indicator to evaluate trend strength, executing trades only when trends are clear (e.g., ADX>25), which can significantly reduce false signals and unnecessary trades in choppy markets.
-
Optimize Entry Timing: Consider adding candlestick pattern or support/resistance level confirmation, such as waiting for price pullbacks to moving averages before entering, rather than entering directly at crossover points, to obtain better entry prices.
-
Adaptive Parameter Settings: Automatically adjust EMA periods and RSI thresholds based on market conditions (high volatility vs. low volatility), allowing the strategy to better adapt to different market environments.
-
Add Time Filtering: Incorporate trading session filtering conditions to avoid times when market liquidity is insufficient or volatility is abnormal, improving trade quality.
-
Optimize Capital Management: Implement progressive position management, moderately increasing position size after consecutive wins and reducing risk exposure after consecutive losses, to optimize the equity curve.
-
Partial Profit Locking Mechanism: Introduce multi-tiered take-profit strategies, such as moving stop-loss to breakeven or partially closing positions when profit reaches certain levels, both securing profits and not missing out on major market moves.
Conclusion
The Dynamic Volatility-Adaptive EMA-RSI Crossover Strategy is a structurally complete and logically clear quantitative trading system that identifies trends through technical indicator combinations and forms an effective trading decision framework integrated with dynamic capital management and risk control mechanisms. The strategy's strengths lie in adapting stop-loss and take-profit positions and position sizes to market volatility, while improving signal quality through RSI filtering and trend reversal position closing. Although risks such as false breakouts and parameter sensitivity exist, these issues can be effectively mitigated through the suggested optimization directions, such as adding trend strength filtering, optimizing entry timing, and introducing adaptive parameters. Overall, this strategy provides a solid quantitative trading foundation suitable for further refinement and optimization to adapt to different market environments and individual risk preferences.
- 1