
Overview
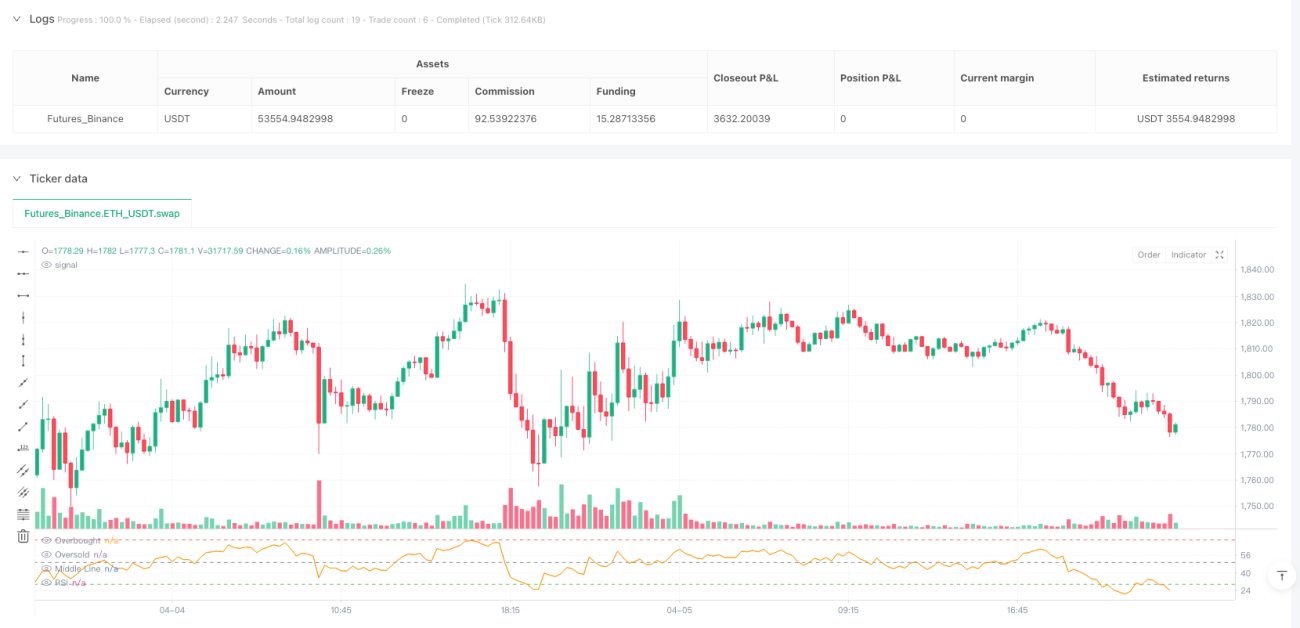
The RSI and MACD Cross-Period Dynamic Trading Strategy is a quantitative trading system that combines the Relative Strength Index (RSI) and Moving Average Convergence Divergence (MACD) indicators, specifically designed for 15-minute chart intervals. This strategy monitors market overbought/oversold conditions (RSI) and price momentum trends (MACD), triggering trading signals when both indicators simultaneously meet specific criteria. Specifically, when the RSI value falls below 30 (oversold) and the MACD fast line crosses above the signal line, the system generates a buy signal; when the RSI value rises above 70 (overbought) and the MACD fast line crosses below the signal line, the system generates a sell signal. Each trade is configured with percentage-based take profit (5%) and stop loss (2%) mechanisms, effectively maintaining a favorable risk-reward ratio of 2.5:1.
Strategy Principles
The core of this strategy lies in combining signals from two classic technical indicators to enhance the reliability of trading decisions:
-
RSI Application: Uses the default 14-period RSI to identify market overbought and oversold conditions. The traditional view considers RSI below 30 as oversold (potential bounce) and above 70 as overbought (potential reversal). The code calculates RSI values using
ta.rsi(close, rsiLength). -
MACD Application: Employs standard parameters with a fast period of 12, slow period of 26, and signal smoothing factor of 9. MACD is calculated through the
ta.macd(close, macdFast, macdSlow, macdSignal)function, yielding the MACD line and signal line. Key trading signals derive from crossovers between the MACD line and signal line, captured by theta.crossoverandta.crossunderfunctions. -
Combined Signal Logic:
- Long entry condition: RSI < 30 (oversold) AND MACD fast line crosses above the signal line
- Short entry condition: RSI > 70 (overbought) AND MACD fast line crosses below the signal line
-
Capital Management: The strategy employs account equity percentage for position sizing (
default_qty_type=strategy.percent_of_equity, default_qty_value=100), investing 100% of total funds in each trade. -
Risk Control: Each trade automatically sets take-profit levels (±5% of entry price) and stop-loss levels (±2% of entry price), implemented through the
strategy.exitfunction.
Strategy Advantages
-
Indicator Confirmation Synergy: By combining RSI and MACD indicators, the strategy requires dual confirmation to issue trading signals, effectively reducing false breakouts and misleading signals, thus improving trade quality.
-
Balanced Entry and Exit Mechanism: Entries are based on objective technical indicator assessments, while exits rely on preset take-profit and stop-loss levels, forming a complete trading loop and reducing subjective interference.
-
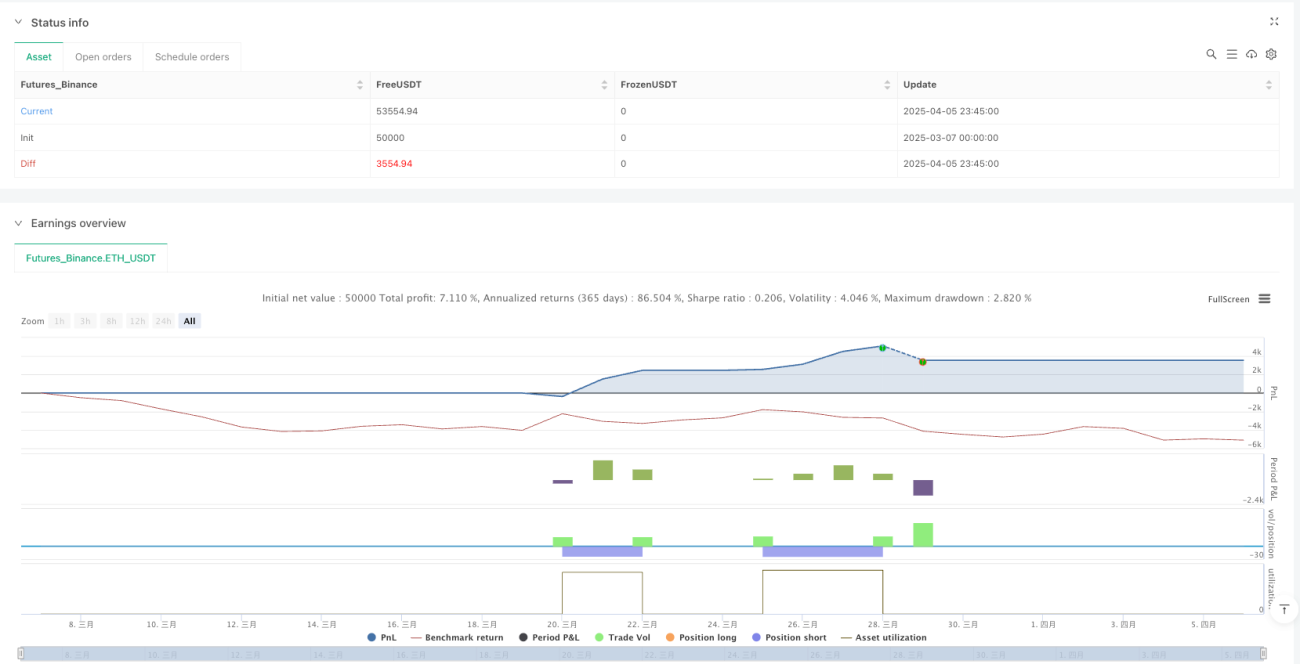
Favorable Risk-Reward Ratio: The take-profit percentage (5%) is 2.5 times the stop-loss percentage (2%), aligning with professional trading risk management principles—requiring only a win rate above 30% to achieve long-term profitability.
-
Market Rhythm Adaptation: The 15-minute timeframe suits intraday traders, capturing short-term fluctuations without overtrading, balancing trading frequency and signal quality.
-
Visual Feedback: The strategy plots the RSI indicator line and overbought/oversold level lines, providing traders with intuitive visual references for real-time market condition monitoring.
Strategy Risks
-
Consolidation Market Risk: In sideways, choppy markets, RSI may frequently oscillate within overbought and oversold zones, while MACD might produce multiple crossovers, leading to overtrading and consecutive losses. A solution is to add supplementary trend filters such as moving averages or the ADX indicator.
-
Parameter Sensitivity: Strategy performance is sensitive to RSI and MACD parameter settings. The current traditional default parameters may not be suitable for all market environments. Parameter optimization based on specific trading instruments and market characteristics is recommended.
-
Fixed Take-Profit and Stop-Loss Limitations: Using fixed percentage-based take-profit and stop-loss levels may not adapt to different market volatility characteristics. High-volatility markets might trigger stop-losses too frequently, while low-volatility markets might struggle to reach take-profit targets.
-
Lack of Trading Time Control: The current strategy does not incorporate trading time filters, potentially generating unfavorable signals during periods of poor liquidity or abnormal volatility.
-
No Position Reversal Mechanism: Long and short signals in the strategy trigger independently, lacking an effective position reversal mechanism, which may lead to significant losses in counter-position holdings during strong trend markets.
Strategy Optimization Directions
-
Dynamic Parameter Adjustment: Consider dynamically adjusting RSI overbought/oversold thresholds and MACD parameters based on market volatility (such as the ATR indicator) to adapt to different market environments. Implementation example:
atrValue = ta.atr(14) dynamicRsiOversold = 30 - (atrValue / close * 100) dynamicRsiOverbought = 70 + (atrValue / close * 100) -
Add Trend Filters: Introduce additional trend confirmation indicators, such as adding the ADX indicator to execute trades only when ADX > 25 (indicating a significant market trend), avoiding frequent trading in oscillating markets:
adxValue = ta.adx(14) adxFilter = adxValue > 25 longCondition = (rsi < rsiOversold) and macdCrossUp and adxFilter -
Optimize Capital Management: Instead of a fixed 100% equity ratio, adopt volatility-based position sizing where position size decreases as volatility increases:
positionSize = 100 / (ta.atr(14) / close * 100) -
Implement Time Filtering: Add trading time window controls to avoid market opening, closing, and low-liquidity periods:
timeFilter = (time >= timestamp("00:30:00")) and (time <= timestamp("23:00:00")) -
Improve Take-Profit and Stop-Loss Mechanisms: Adopt technically-based exit points such as previous highs/lows, support/resistance levels, or ATR multiples as dynamic stop points, rather than fixed percentages:
            atrValue = ta.atr(14)
dynamicStopLoss = atrValue * 1.5
Summary
The RSI and MACD Cross-Period Dynamic Trading Strategy is a clearly structured, logically defined quantitative trading system that integrates the strengths of overbought/oversold indicators (RSI) and momentum trend indicators (MACD) to provide relatively reliable trading signals. This strategy is particularly suitable for short-term trading on 15-minute timeframes, with core advantages in its dual-indicator confirmation mechanism and explicit capital risk management rules.
While the strategy design is reasonable, challenges remain in parameter sensitivity and market adaptability. By introducing dynamic parameter adjustments, trend filters, optimized capital management, time filtering, and improved take-profit and stop-loss mechanisms, the strategy's robustness and adaptability can be further enhanced.
Any quantitative strategy requires comprehensive historical backtesting and forward validation, alongside customization to specific market conditions and trader risk preferences. This strategy provides an excellent quantitative trading framework upon which traders can build through secondary development and optimization to construct more refined trading systems.
- 1