
Overview
The Multi-Indicator Integrated Trend Following Trading Strategy is a quantitative trading system that utilizes multiple technical indicators to determine market trend direction and strength. This strategy cleverly combines moving averages, Relative Strength Index (RSI), Average Directional Index (ADX), On-Balance Volume (OBV), and other indicators, while also integrating candlestick pattern analysis and trading session filtering. Through multi-level condition screening, it ensures capturing high-probability trading opportunities in strong trending markets. The strategy particularly focuses on cross-verification between indicators, executing trades only when multiple technical signals confirm simultaneously, effectively reducing the risk of false signals.
Strategy Principles
This strategy operates based on the following core principles:
-
Trend Confirmation System: Uses the crossover and relative position of Fast EMA (50 periods) and Slow EMA (200 periods) to determine the primary market trend direction. When the Fast EMA is above the Slow EMA, an uptrend is confirmed; otherwise, a downtrend is confirmed.
-
Strength Measurement: Measures trend strength through a custom ADX indicator, trading only when the ADX value exceeds a set threshold (default 20), avoiding weak trends or oscillating markets.
-
Multi-level Confirmation Mechanism: Designed an intelligent signal system called "aiStrength" that comprehensively evaluates five key market factors:
- EMA trend direction
- OBV trend direction
- ADX trend strength
- Engulfing pattern occurrence
- Short-term and medium-term EMA crossover
A trading signal is generated only when at least 4 factors simultaneously confirm.
-
Candlestick Pattern Validation: Additionally identifies special candlestick patterns such as engulfing patterns, doji stars, and pin bars as confirmation signals for trend reversal or continuation.
-
Volume Confirmation: Requires volume to be 1.5 times higher than the 20-period average volume, ensuring sufficient market participation supports price movements.
-
Indicator Divergence Identification: Detects divergences between price and RSI/ADX, serving as early warning signals for potential trend reversals.
-
Oscillation Market Filtering: Identifies and avoids oscillating markets through combined analysis of price range fluctuations with ADX and RSI.
-
Trading Session Optimization: Restricts trading to specific sessions (14:00-23:00 in UTC+7 timezone), corresponding to major market active periods, improving signal quality.
-
Dynamic Risk Management: Dynamically sets stop-loss and take-profit levels based on ATR, and applies trailing stop mechanisms to protect profits. The risk-reward ratio is set at 2.0, while using a 1.5x ATR trailing stop to protect existing profits.
Strategy Advantages
-
Multi-dimensional Market Analysis: By integrating multiple indicators including moving averages, RSI, ADX, and OBV, the market is analyzed from different angles, reducing the risk of misleading signals from any single indicator.
-
Strong Adaptability: The strategy uses ATR-based stop-loss and take-profit settings, automatically adapting to different market volatilities, maintaining effectiveness in both high and low volatility environments.
-
High-level Filtering System: Through multiple condition screening (trend direction, strength confirmation, volume verification, candlestick patterns, trading sessions, etc.), effectively filters out numerous low-quality signals, significantly enhancing the reliability of trading signals.
-
Intelligent Oscillation Market Recognition: The strategy has a built-in oscillation market recognition mechanism, actively avoiding trading when the market is in a clear sideways state, reducing the risk of losses in high-uncertainty environments.
-
Dynamic Profit Protection: Applying ATR-based trailing stops allows for effectively locking in profits while maintaining sufficient upside potential, balancing risk and reward.
-
Combination of Patterns and Indicators: Combines traditional technical analysis candlestick patterns (engulfing, doji, pin bars) with modern technical indicators, leveraging the strengths of each and providing mutual verification.
-
Divergence Warning System: By detecting divergences between price and RSI/ADX, potential trend weakness or imminent reversals are identified in advance, enhancing the strategy's predictive ability.
-
Trading Session Optimization: Focuses on trading during highly active market sessions, avoiding periods of low liquidity and unstable volatility, improving trading efficiency.
Strategy Risks
-
Overreliance on Indicator Resonance: The strategy requires multiple indicators to confirm simultaneously to generate signals. While this improves signal quality, it may lead to missing some effective trading opportunities, especially in fast-moving markets.
-
Parameter Optimization Challenges: The strategy involves multiple parameter settings (such as EMA length, RSI period, ADX threshold, etc.), and different market environments may require different parameter combinations, increasing the complexity of parameter optimization.
-
Unstable Trading Frequency: Due to strict entry conditions, there may be extended periods without trading signals in certain market phases, affecting capital utilization efficiency. A solution is to consider increasing the number of tradable market instruments or appropriately relaxing certain conditions.
-
Drawdown Risk: Despite using ATR-based stop-loss settings, in extreme market conditions (such as gaps or flash crashes), actual stop-losses may experience significant slippage, leading to unexpected losses. Additional risk control measures are recommended, such as overall position management and daily maximum loss limits.
-
Market State Misjudgment: Although the strategy's oscillation market identification mechanism is effective, it may misjudge in certain complex market environments, incorrectly filtering out valuable trading opportunities or erroneously entering unsuitable markets.
-
Algorithmic Complexity Risk: The strategy logic is relatively complex, and multiple condition judgments may lead to programming errors or logical contradictions, requiring strict backtesting and live monitoring to ensure strategy stability.
-
Overfitting Risk: As the strategy employs multiple indicators and conditions, there is a risk of overfitting historical data, potentially leading to future live performance not meeting expectations. Thorough testing under different time periods and market conditions is recommended.
Strategy Optimization Directions
-
Adaptive Parameter Adjustment: The current strategy uses fixed parameter settings. Consider introducing an adaptive parameter adjustment mechanism that dynamically adjusts EMA length, RSI threshold, ADX threshold, and other parameters based on market volatility and trend strength, improving the strategy's adaptability across different market environments.
-
Market State Classification Optimization: The existing oscillation market identification mechanism can be further refined by classifying market states into strong uptrend, weak uptrend, strong downtrend, weak downtrend, and oscillation, applying different trading strategies and parameter combinations for different market states.
-
Entry Timing Precision: Add entry optimization based on market microstructure, such as support/resistance breakout confirmation and price volatility analysis, further improving the precision of entry points.
-
Position Management Strategy Enhancement: The current strategy uses fixed proportion fund management. Consider introducing volatility-based dynamic position management, increasing positions with high-confidence signals and low market risk, and vice versa, optimizing capital usage efficiency.
-
Multiple Timeframe Analysis: Introducing multiple timeframe analysis can significantly enhance strategy effectiveness, such as using larger timeframes (like 1-hour or 4-hour) to confirm the main trend direction, then seeking specific entry points on 15-minute charts, reducing counter-trend trading risk.
-
Machine Learning Optimization for Signal Weighting: Utilize machine learning techniques to analyze historical data and assign dynamic weights to different indicator signals, rather than simply counting the number of confirming signals, thereby more accurately evaluating market conditions and the quality of trading opportunities.
-
Stop-Loss Strategy Refinement: The current strategy uses a uniform ATR multiplier for stop-loss. Consider customizing more detailed stop-loss strategies based on market volatility characteristics and entry reasons, such as structure-based stops using support/resistance, time-based stops, or volatility-adjusted stops.
-
Seasonality and Market Cycle Analysis: Add analysis of seasonality factors and market cycles, adjusting strategy parameters or pausing trading during specific periods (such as month beginning/end, before/after quarterly settlements), avoiding historically anomalous volatility periods.
Conclusion
The Multi-Indicator Integrated Trend Following Trading Strategy is an ingeniously designed quantitative trading system that effectively identifies and tracks market trends through the comprehensive application of multiple technical analysis tools and trading concepts. The strategy's most notable highlight is its multi-level signal confirmation mechanism, which significantly reduces the possibility of erroneous signals by requiring multiple different types of indicators to simultaneously point in the same trading direction.
The strategy also cleverly integrates traditional candlestick pattern analysis with modern technical indicators, adding volume confirmation and trading session optimization to form a comprehensive and systematic trading decision framework. The ATR-based dynamic risk management design also reflects the strategy's emphasis on capital safety, providing traders with a reasonable risk control mechanism.
Although the strategy has limitations such as complex parameter optimization and potentially missing some trading opportunities, through the suggested optimization directions like adaptive parameter adjustment, multiple timeframe analysis, and machine learning signal optimization, the strategy's performance can be further enhanced. Overall, this is a logically rigorous and well-designed quantitative trading strategy, particularly suitable for traders pursuing steady returns with a focus on risk control.
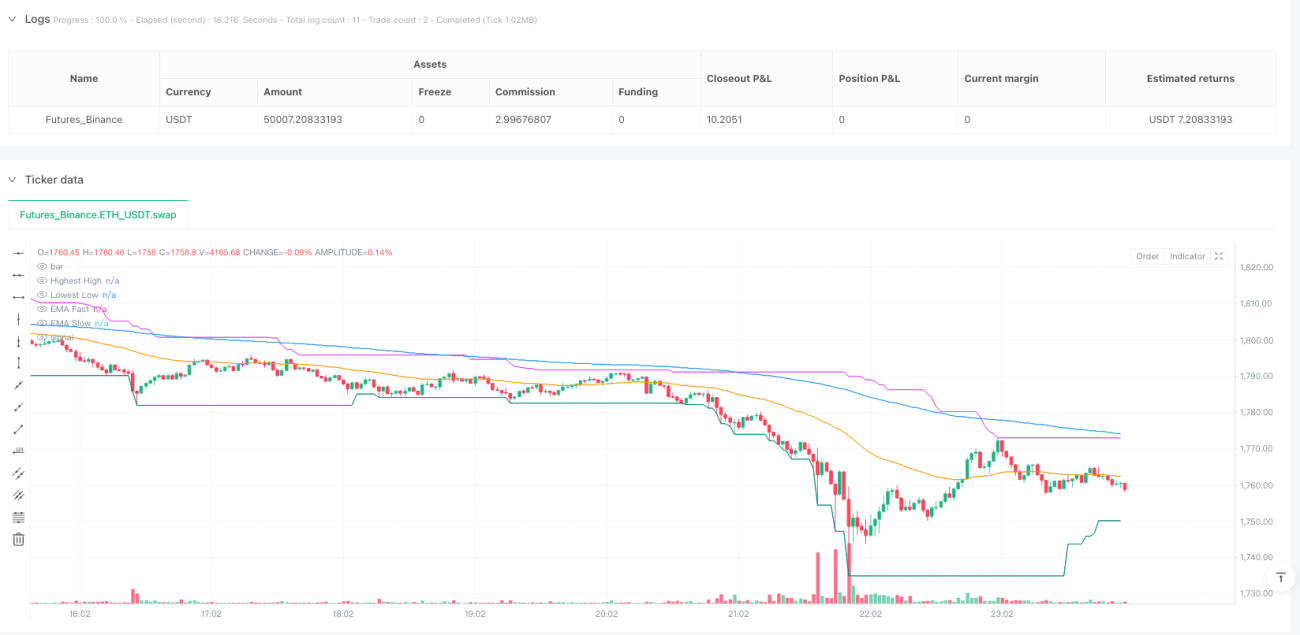
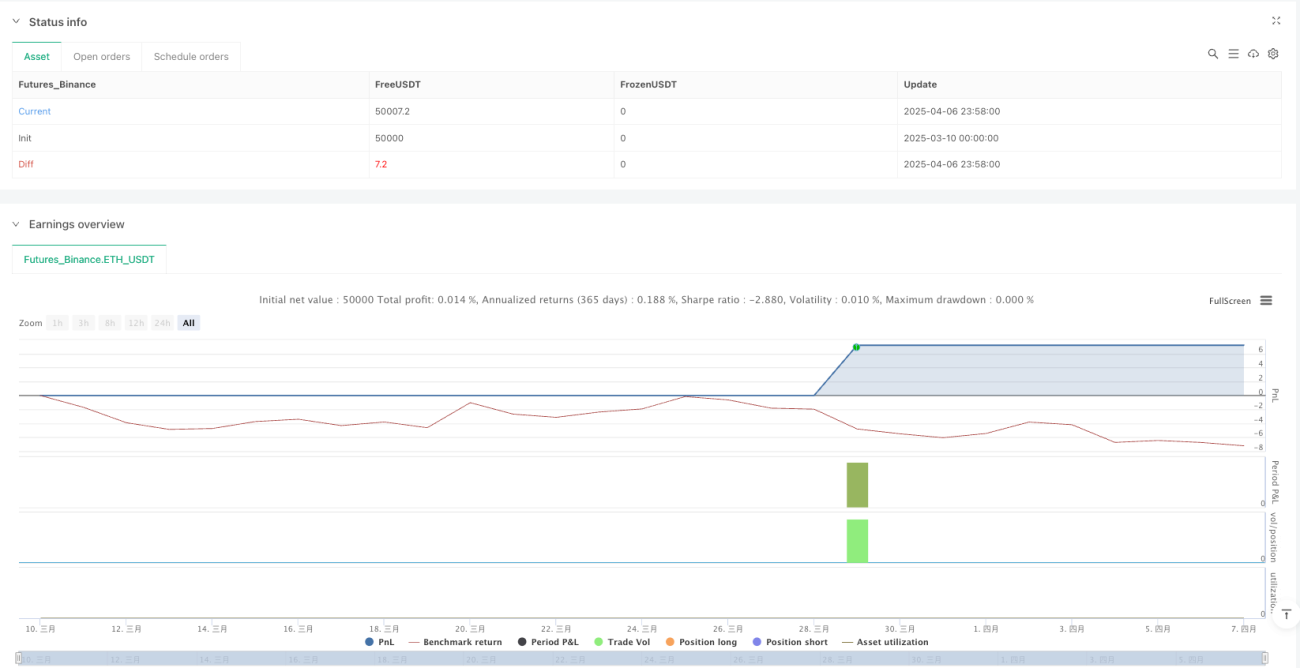
/*backtest
start: 2025-03-10 00:00:00
end: 2025-04-07 00:00:00
period: 2m
basePeriod: 2m
exchanges: [{"eid":"Futures_Binance","currency":"ETH_USDT"}]
*/

//@version=5
strategy("TUONG HA GBP M15 Trend Strategy NHIEU CHI BAO TICH HOP", overlay=true, default_qty_type=strategy.percent_of_equity, default_qty_value=10)

// === INPUTS ===- 1