
Overview
This strategy combines Smart Money Concepts (SMC) with Bollinger Band breakouts, enhanced by a momentum confirmation mechanism to improve signal reliability. The core approach identifies price breakouts beyond Bollinger Bands while requiring Market Structure Shift (MSS) signals, with optional higher timeframe trend confirmation. By incorporating a momentum candle filter that requires entry signals to have sufficient price momentum, the strategy significantly improves win rates and risk-reward ratios.
Strategy Principles
The strategy operates through the synergistic action of three core technical components:
-
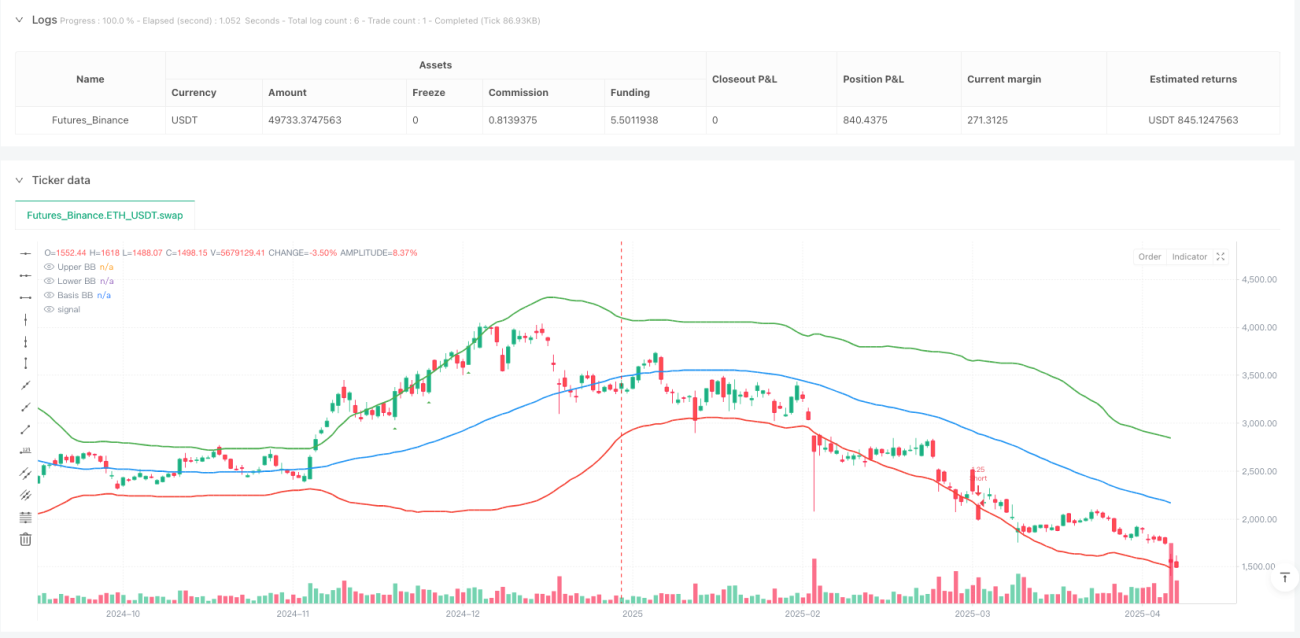
Bollinger Bands Indicator: Uses standard deviation to calculate price volatility range, forming upper, lower, and middle bands. When price breaks above the upper band, it generates a long signal; breaking below the lower band generates a short signal. In this strategy, the Bollinger Band period is 55 with a standard deviation multiplier of 2.0.
-
Smart Money Concepts (SMC):
- Order Blocks: Calculates the highest high and lowest low within a specific lookback period (default 20 periods) to form potential support and resistance zones.
- Liquidity Zones: Identifies recent swing highs and lows (default 12 periods) to determine areas where market liquidity may exist.
- Market Structure Shift (MSS): When closing price breaks above a previous high, a bullish market structure shift forms; when closing price breaks below a previous low, a bearish market structure shift forms.
-
Momentum Confirmation Mechanism: Requires the entry candle's body to represent a specific percentage of its total height (default 70%), ensuring sufficient momentum behind the breakout. Bullish momentum candles display in bright green, while bearish momentum candles display in bright red.
Entry Conditions:
- Long Condition: Closing price breaks above the upper Bollinger Band + Bullish market structure shift + (Optional) Higher timeframe in uptrend + (Optional) Sufficient bullish momentum
- Short Condition: Closing price breaks below the lower Bollinger Band + Bearish market structure shift + (Optional) Higher timeframe in downtrend + (Optional) Sufficient bearish momentum
Exit Conditions:
- Long Exit: Closing price falls below the Bollinger Band middle line or closing price falls below 99% of the order block low
- Short Exit: Closing price breaks above the Bollinger Band middle line or closing price rises above 101% of the order block high
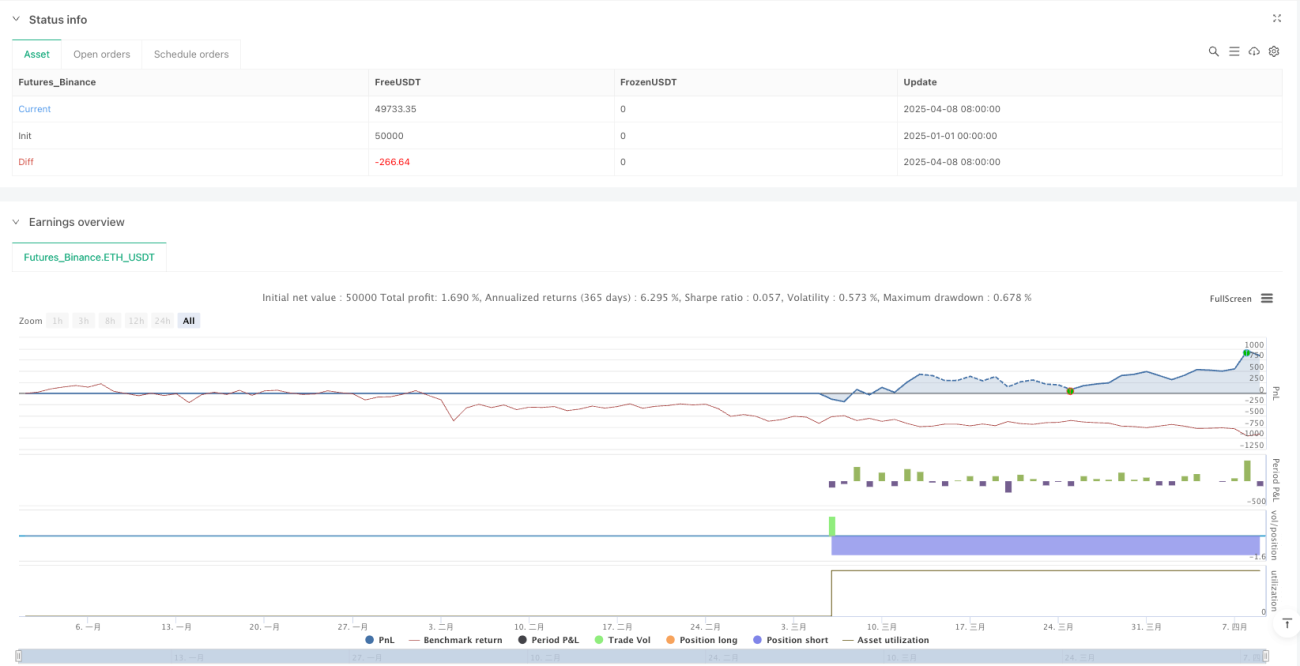
For money management, the strategy employs an equity-based risk control method, limiting each trade to 5% of account equity to control maximum risk exposure per trade.
Strategy Advantages
-
Multiple Confirmation Mechanisms: By combining Bollinger Band breakouts, market structure shifts, and momentum confirmation, a multi-level trade signal filtering mechanism is formed, significantly reducing false signals.
-
Integration of Trend and Momentum: The strategy focuses not only on trend changes (through Bollinger Bands and MSS) but also on price momentum (through momentum candles), achieving a perfect combination of trend following and momentum capture.
-
Timeframe Synergy: The optional higher timeframe trend confirmation feature (default daily level) effectively avoids counter-trend trading, improving the success rate of trend-following trades.
-
Visual Intuitiveness: The strategy provides clear visual aids, including Bollinger Bands, order block lines, swing high/low lines, and momentum candle color markings, allowing traders to intuitively understand market conditions.
-
Flexibility: Strategy parameters are highly customizable, including Bollinger Band length, standard deviation multiplier, order block lookback length, swing lookback length, and momentum candle threshold, adaptable to different market environments.
-
Intelligent Money Management: Uses an equity-based position sizing method, effectively managing risk and preventing single trades from causing excessive losses.
Strategy Risks
-
Over-optimization Risk: The strategy includes multiple adjustable parameters, such as Bollinger Band length (55), standard deviation multiplier (2.0), and lookback periods, which can easily lead to parameter over-optimization and curve-fitting problems. The solution is to conduct robustness testing across different timeframes and market environments.
-
Lag Issues: Both Bollinger Bands and SMC elements are calculated based on historical data and have certain lag, potentially leading to less-than-ideal entry timing. The solution is to integrate price action analysis and other leading indicators to assist judgment.
-
Trend Reversal Risk: In strong market reversals, the strategy may experience consecutive losses. The solution is to add trend reversal detection mechanisms or pause trading during extreme market conditions.
-
Money Management Challenges: A fixed 5% capital allocation may be too risky in highly volatile markets. The solution is to dynamically adjust capital allocation ratios according to market volatility.
-
Liquidity Risk: In markets with lower liquidity, order blocks and liquidity zones may not be accurate enough. The solution is to add volume confirmation mechanisms or only apply the strategy in markets with sufficient liquidity.
Strategy Optimization Directions
-
Dynamic Parameter Adjustment: Introduce adaptive mechanisms to automatically adjust the Bollinger Band standard deviation multiplier and length parameters based on market volatility, allowing the strategy to better adapt to different market environments. This addresses the issue of static parameters performing inconsistently under different market conditions.
-
Enhanced Trend Identification: Introduce additional trend indicators, such as Directional Movement Index (DMI) or Average Directional Index (ADX), to further confirm trend strength and avoid excessive trading in weak trend markets.
-
Improved Exit Mechanisms: The current exit mechanism is relatively simple; consider introducing more flexible exit methods such as trailing stops, moving average crossovers, or ATR multiple stops to better protect profits.
-
Integration of Volume Analysis: Add volume confirmation mechanisms to the strategy, requiring price breakouts to be accompanied by significant volume increases, further improving signal quality. Volume, as an important market participation indicator, can effectively verify the authenticity of price momentum.
-
Introduction of Time Filters: Markets display different characteristics during different trading sessions; add time filters to avoid generating signals during specific inefficient trading sessions (such as the Asian session consolidation period).
-
Optimized Money Management: Introduce ATR-based position sizing methods to dynamically adjust risk exposure based on market volatility, reducing exposure in high-volatility markets and appropriately increasing positions in low-volatility markets.
Summary
The Momentum-Driven Bollinger Breakout with Smart Money Concepts Integration Strategy is a comprehensive trading system combining technical analysis and market structure theory. This strategy captures price momentum through Bollinger Band breakouts, identifies key price levels and market structure changes using SMC theory, and enhances signal reliability through a momentum candle filter. The multi-level signal confirmation mechanism significantly reduces false signals, while the optional higher timeframe trend confirmation helps avoid counter-trend trading.
Although the strategy has clear logic and multiple advantages, traders still need to be aware of potential risks, including parameter optimization risk, lag issues, and trend reversal risk. By introducing dynamic parameter adjustments, enhanced trend identification, improved exit mechanisms, and integrated volume analysis, the strategy's robustness and adaptability can be further enhanced.
Ultimately, traders should remember that there is no perfect trading strategy. The key lies in understanding the core logic of the strategy, managing risk reasonably, and flexibly adjusting according to different market environments. Before practical application, it is recommended to conduct thorough backtesting and forward testing to verify the strategy's performance under different market conditions.
- 1