
Overview
The Multi-Indicator Divergence Trading System with Advanced Risk Management is a sophisticated quantitative trading strategy designed to capitalize on market divergence signals while implementing disciplined risk management. This strategy ingeniously integrates three popular technical analysis indicators (RSI, MACD, and Stochastic) to identify bullish and bearish trends through crossover signals. The system allows traders to flexibly choose whether to enable specific indicators for analytical decision-making, enhancing the strategy's adaptability. Additionally, a trend filter based on a 50-period moving average ensures that trading direction aligns with the primary market trend, effectively avoiding high-risk counter-trend trading. For risk management, the strategy implements both fixed stop-loss and take-profit levels, as well as a trailing stop function, which both limits potential losses and secures realized profits, forming a comprehensive trading decision and position management system.
Strategy Principles
The core principle of the Multi-Indicator Divergence Trading System is to improve the accuracy and reliability of trading decisions through collaborative verification of multiple indicator signals. The specific implementation mechanism is as follows:
-
Indicator Calculation and Signal Generation:
- RSI Indicator: Calculates the 14-period RSI value and its 14-period SMA, generating a bullish signal when RSI crosses above SMA and a bearish signal when crossing below
- MACD Indicator: Calculated based on 12, 26, and 9 period parameters, producing a bullish signal when the MACD line crosses above the signal line and a bearish signal when crossing below
- Stochastic Indicator: Calculates the 14-period stochastic value and its 14-period SMA, with crossovers generating corresponding signals
-
Signal Integration and Filtering:
- The basic buy condition requires all enabled indicators to show bullish signals
- The trend filter further requires the price to be above the 50-period moving average, ensuring trend-following trades
- The final buy signal must meet both the basic conditions and trend filter conditions
-
Execution and Risk Management:
- When conditions are met, the system opens a long position
- Stop-loss (default 1.5%) and take-profit (default 3%) levels are calculated based on the average entry price
- A trailing stop is simultaneously enabled, adjusting the stop-loss position as the price moves in a favorable direction
This architectural design ensures that trading decisions are based on the consensus of multidimensional technical indicators, rather than isolated signals from a single indicator, significantly improving signal reliability.
Strategy Advantages
Through deep analysis of the strategy's code structure, the following significant advantages can be summarized:
-
Multi-Indicator Collaborative Verification: By integrating signals from RSI, MACD, and Stochastic indicators, the strategy reduces false signals that might be generated by a single indicator, improving the reliability of trading signals. Each indicator captures different characteristics of the market, working together to form a more comprehensive market insight.
-
Flexible Indicator Configuration: The strategy allows users to enable or disable specific indicators based on particular market environments or personal preferences, enhancing the strategy's adaptability and personalization. This modular design enables the strategy to adapt to different market conditions.
-
Integration of Trend Filter: By requiring the price to be above the moving average before executing long trades, the strategy effectively avoids counter-trend trading, significantly improving the win rate. This design aligns with the core principle of "follow the trend" in technical analysis.
-
Comprehensive Risk Management Mechanism:
- Fixed stop-loss limits the maximum loss per trade
- Preset take-profit levels secure reasonable profits
- Trailing stop function allows profits to continue growing while protecting realized gains
- Fund management adopts account equity proportion allocation rather than fixed lot sizes, which is more scientific
-
Clear Visual Signals: The strategy clearly marks buy and sell signals on the chart, facilitating backtesting verification and real-time monitoring, improving the strategy's usability and transparency.
These advantages make this strategy a powerful tool suitable for both beginners learning systematic trading methods and experienced traders seeking robust systems.
Strategy Risks
Despite the comprehensive design of this strategy, there are several potential risks to be aware of:
-
Delay in Multi-Indicator Convergence: Requiring multiple indicators to simultaneously generate signals may lead to delayed entry points, missing optimal entry opportunities. When signals trigger after the market has completed most of its movement, there's a risk of "chasing highs" or "bottoming too early." The solution is to adjust indicator parameters to increase sensitivity or consider reducing the number of indicators required to coincide.
-
Over-reliance on Technical Indicators: The strategy is entirely based on technical indicators, ignoring fundamental factors and market sentiment. During major news events or black swan events, the effectiveness of pure technical indicators may significantly decrease. It's recommended to incorporate macroeconomic factors and market news for manual intervention in live trading.
-
Limitations of Fixed Parameters: The strategy uses fixed indicator parameters and risk management settings, which may not be suitable for all market environments. Different market volatilities and trend strengths may require different parameter settings. The solution is to implement parameter optimization or adaptive parameter mechanisms.
-
Limitations of Unidirectional Trading: The current strategy only executes long trades, potentially missing profit opportunities in bearish markets. This may lead to poor long-term performance in bear markets or range-bound markets. Consider adding short trading functionality or pausing trading during clear bearish trends.
-
Fund Management Risk: Although the strategy adopts equity proportion allocation, the fixed 10% proportion may be too high or too low, depending on individual risk tolerance and market volatility characteristics. It's recommended to adjust this parameter based on personal risk preferences and account size.
Identifying and understanding these risk factors are key steps in effectively managing and optimizing this strategy. The strategy's robustness and long-term performance can be improved through appropriate risk mitigation measures.
Strategy Optimization Directions
Based on in-depth analysis of the code, here are key directions for further optimization of this strategy:
-
Addition of Short Strategy: The current strategy only implements long trading functionality. To comprehensively capture market opportunities, it's recommended to add complete logic for short trading, including trend filtering (price below moving average) and corresponding risk management mechanisms. This would not only profit in falling markets but also improve the strategy's overall profit potential.
-
Adaptive Parameter Mechanism: Fixed indicator parameters may not adapt to different market environments. Introducing volatility-based adaptive parameter adjustment mechanisms, such as using longer-period parameters in high-volatility environments and more sensitive short-period parameters in low-volatility times, can significantly improve the strategy's adaptability.
-
Optimize Trend Filter: Consider using multi-period trend confirmation or adding trend strength indicators (such as ADX) to improve the accuracy of trend judgment. This helps avoid frequent trading in weak trend or oscillating markets, reducing trading costs and improving win rates.
-
Signal Strength Grading: The current strategy treats all qualifying signals as equally important. Introducing a signal strength scoring system that allocates weights based on factors such as indicator divergence degree and crossing angle, and adjusting position size accordingly, can more finely manage risk and return.
-
Time Filter: Adding trading time filtering functionality to avoid low liquidity market sessions or important economic data release periods can reduce the impact of slippage and adverse price jumps.
-
Stop-Loss Optimization: Consider using dynamic stops based on ATR (Average True Range) rather than fixed percentage stops, making risk management better adapted to current market volatility. This method provides more reasonable risk control in different volatility environments.
-
Drawdown Control Mechanism: Adding a risk management layer based on account performance, such as reducing position size or pausing trading after consecutive losses and gradually restoring normal positions when the strategy performs well, can effectively control maximum drawdown magnitude.
These optimization directions aim to improve the strategy's adaptability, robustness, and long-term profitability, enabling it to remain competitive in various market environments.
Conclusion
The Multi-Indicator Divergence Trading System with Advanced Risk Management constructs a logically rigorous and highly practical quantitative trading framework by integrating crossover signals from RSI, MACD, and Stochastic indicators, combined with moving average trend filtering and a comprehensive risk management system. Its core advantage lies in the collaborative verification mechanism of multidimensional technical indicators, effectively reducing false signals and improving the reliability of trading decisions. Flexible indicator configuration options and clear signal visualization make this strategy suitable for traders of different experience levels.
Despite potential risks such as multi-indicator convergence delay and unidirectional trading limitations, by implementing the recommended optimization measures—such as supplementing short strategy, introducing adaptive parameter mechanisms, optimizing trend filtering, and improving risk management systems—this strategy has the potential to further enhance its market adaptability and long-term performance.
The design philosophy of this strategy reflects important principles in quantitative trading: multidimensional signal verification, trend-following, and strict risk control. For traders seeking systematic trading methods and robust risk management, this is a strategy framework worth referencing and further developing. Whether technical analysis enthusiasts or professional quantitative traders, valuable trading ideas and risk management concepts can be gained from this framework.
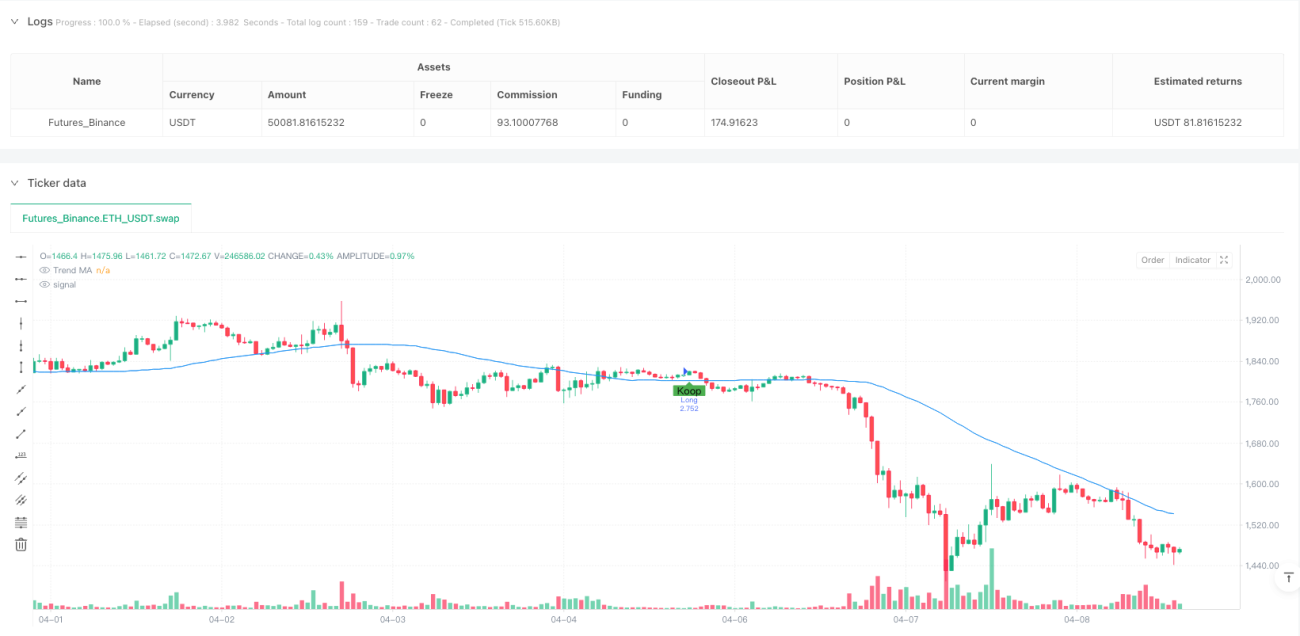
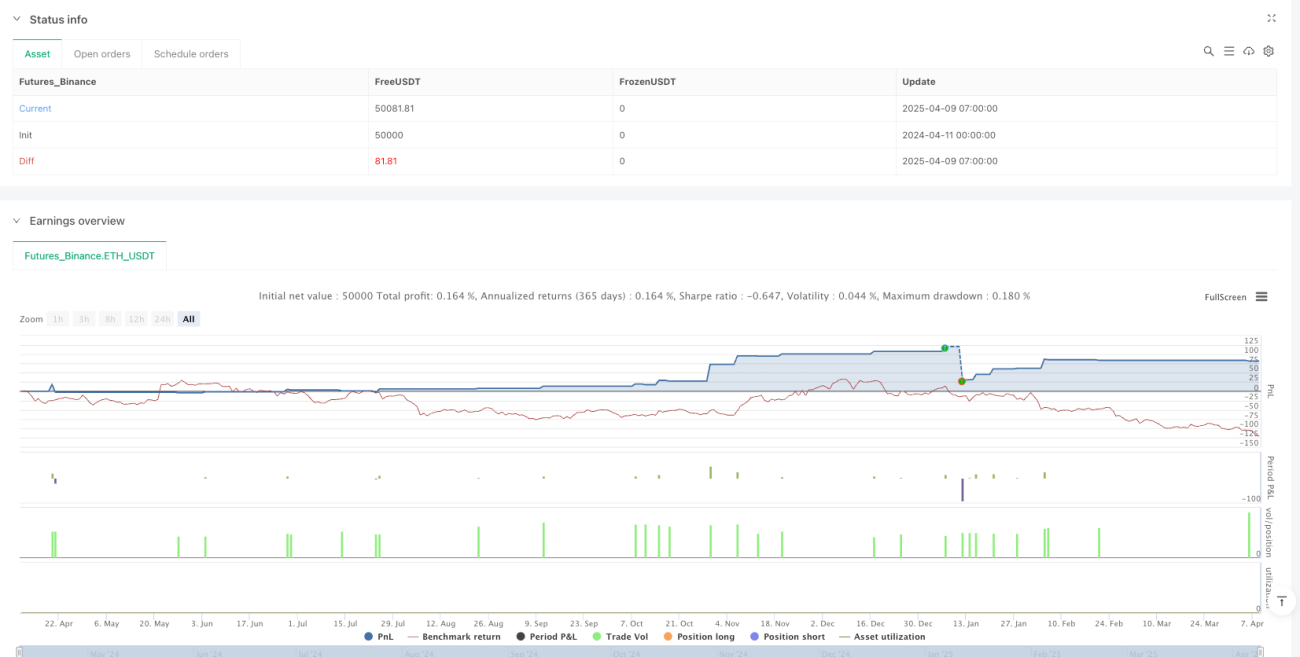
/*backtest
start: 2024-04-11 00:00:00
end: 2025-04-09 08:00:00
period: 1h
basePeriod: 1h
exchanges: [{"eid":"Futures_Binance","currency":"ETH_USDT"}]
*/

//@version=5
strategy("Multi-Divergence Strategy - Verbeterd", overlay=true, initial_capital=100000, default_qty_type=strategy.percent_of_equity, default_qty_value=10)

// === INVOERPARAMETERS ===- 1