
Overview
This strategy is a comprehensive trading system that utilizes multi-timeframe analysis, technical indicator confluence, and pattern recognition to identify high-probability trading opportunities. Its core philosophy is to analyze trend alignment across five different timeframes (1-minute, 5-minute, 15-minute, 1-hour, and 4-hour), combined with volume breakouts, engulfing patterns, and momentum indicators to precisely capture market movements. The strategy also incorporates automatic take-profit and stop-loss mechanisms that dynamically adjust risk management parameters based on market volatility.
Strategy Principles
The strategy is built around several key components:
-
Multi-timeframe Trend Analysis: The strategy first analyzes trends across 5 different timeframes using a custom
getTrend()function. On each timeframe, it checks if the fast EMA is above the slow EMA, if RSI is above 50, and if price is above the fast EMA to determine a buy signal; opposite conditions determine a sell signal. -
Trend Confluence Confirmation: The system only considers entry when all five timeframes show trend signals in the same direction. This strict trend confluence mechanism significantly increases the reliability of signals.
-
Entry Condition Optimization: Beyond trend confluence, entries also require:
- Engulfing pattern (bullish or bearish) confirmation
- Volume spike (greater than 2x the 20-period average volume)
- RSI confirmation (>55 for longs, <45 for shorts)
- Choppiness Index (CMI) >30 (ensuring sufficient market momentum)
- Price position confirmation relative to Volume Weighted Moving Average (VWMA)
-
Risk Management System: The strategy employs dynamic stop-loss calculation based on recent price volatility (high-low range) and uses a multiplier parameter (default 2.0) to set take-profit targets.
-
Support/Resistance Visualization: The system automatically identifies and displays important support and resistance levels, providing visual assistance for understanding the current market structure.
Strategy Advantages
-
Multi-dimensional Signal Filtering: By requiring confluence across multiple technical indicators and timeframes, the strategy significantly reduces the possibility of false signals. This multi-confirmation mechanism ensures the strategy only triggers trade signals in high-probability setups.
-
Adaptive Risk Management: Stop-loss and take-profit levels are not fixed but dynamically calculated based on current market volatility, allowing the strategy to maintain appropriate risk-reward ratios in varying volatility conditions.
-
Comprehensive Visualization System: The strategy includes comprehensive visual aids including a trend dashboard, support/resistance boxes, trade signal markers, and projected take-profit/stop-loss lines, providing traders with intuitive market analysis.
-
Volume Confirmation: By requiring trade signals to be accompanied by significant volume increases, the strategy identifies market moves with actual momentum rather than just random price fluctuations.
-
Pattern Recognition Integration: Engulfing patterns as part of the entry conditions add accuracy to the strategy, as these candlestick formations often represent significant shifts in market sentiment.
Strategy Risks
-
Frequent Rebalancing Requirement: Due to the strategy's reliance on confluence across multiple timeframes, trade signals may be relatively rare. In cases of long periods without trading opportunities, traders might be tempted to lower standards, leading to suboptimal trade execution.
-
Signal Dependency: The strategy heavily relies on technical indicators and patterns which may fail or provide misleading indications in certain market conditions, such as during breaking news events or extreme volatility periods.
-
Over-optimization Risk: The strategy uses multiple parameters and conditions, which could lead to over-optimization on historical data and poor performance in real market conditions. Thorough backtesting across sufficient timeframes and varied market conditions is necessary.
-
Computational Complexity: Multi-timeframe analysis and multiple indicator calculations require significant computational resources, which might cause performance issues or delays on some trading platforms.
-
Trend Reversal Detection Lag: Due to the requirement for confluence across multiple timeframes, the strategy may miss opportunities in the early stages of trend reversals until the new trend is established across all timeframes.
Optimization Directions
-
Adaptive Parameter Adjustment: Introduce mechanisms to automatically adjust EMA lengths, RSI thresholds, and CMI requirements based on current market volatility or trading session to adapt to different market states.
-
Timeframe Weighting System: Instead of simply requiring all timeframes to align, implement a weighting system where higher timeframe signals have greater influence, which might produce more timely signals while maintaining quality standards.
-
Market State Classification: Add an algorithm to detect whether the current market is in a trending or ranging state and adjust strategy parameters accordingly. For example, higher CMI thresholds might be required in ranging markets.
-
Machine Learning Integration: Utilize machine learning algorithms to optimize entry and exit rules, identifying the most effective signal combinations based on historical data and continuously improving as new data accumulates.
-
Enhanced Diversification: Add other uncorrelated technical indicators such as Fibonacci retracement levels, key price levels, or market sentiment indicators to provide additional dimensions of confirmation.
Summary
The Multi-Timeframe Momentum Confluence Automated Trading Strategy is a comprehensive trading system that identifies high-probability trading opportunities through a strict multi-confirmation mechanism. By combining trend analysis, volume confirmation, pattern recognition, and dynamic risk management, the strategy aims to provide high-quality trade signals while managing risk on each trade.
While the strategy's strict conditions may result in relatively few trading signals, this is actually one of its main strengths as it prioritizes signal quality over quantity. With the suggested optimization measures, particularly adaptive parameters and market state classification, the strategy can further enhance its performance and adaptability.
For traders seeking a systematic, disciplined approach to trading, this multi-faceted analysis and strict confirmation methodology provides a robust framework that can maintain consistency across different market environments while reducing the impact of emotional bias through automated rules.
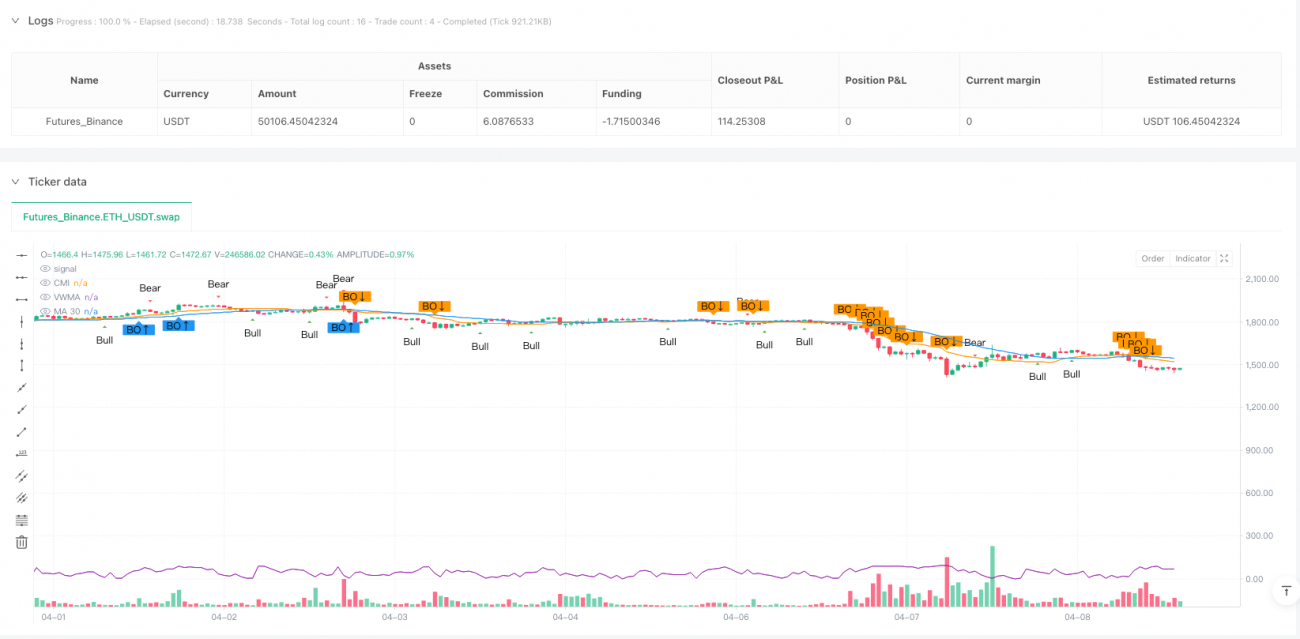
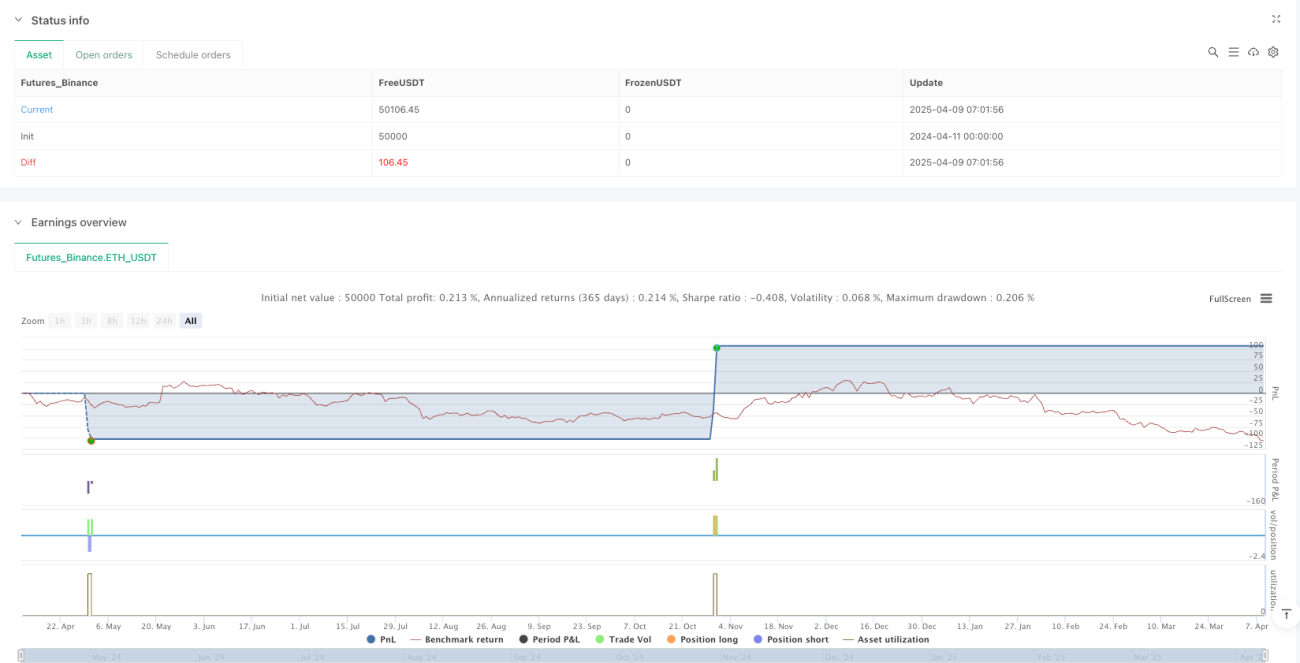
/*backtest
start: 2024-04-11 00:00:00
end: 2025-04-09 08:00:00
period: 1h
basePeriod: 1h
exchanges: [{"eid":"Futures_Binance","currency":"ETH_USDT"}]
*/

//@version=5
strategy("M.Shiham-XAUUSD Sniper Strategy", overlay=true, default_qty_type=strategy.percent_of_equity, default_qty_value=10, max_lines_count=500, max_boxes_count=500)

// === Input ===- 1