
Overview
The Multi-Indicator Trend Breakout Strategy with Dynamic Stop-Loss is a modernized trading system based on Donchian Channel breakout principles, inspired by Curtis Faith's "Way of the Turtle." This strategy has been specifically optimized to adapt to the high volatility and frequent false breakouts characteristic of 24/7 trading markets. The system integrates multiple technical indicators as filtering conditions, including Exponential Moving Average (EMA) trend confirmation, Relative Strength Index (RSI) momentum verification, Adaptive True Range (ATR) stop-loss mechanism, and optional volatility and volume filters, creating a comprehensive and flexible trading framework.
Strategy Principles
The core principle of this strategy is to capture trending price movements after breakouts of historical high and low points, while applying multiple filtering mechanisms to reduce the risk of false breakouts and premature entries. The specific implementation logic is as follows:
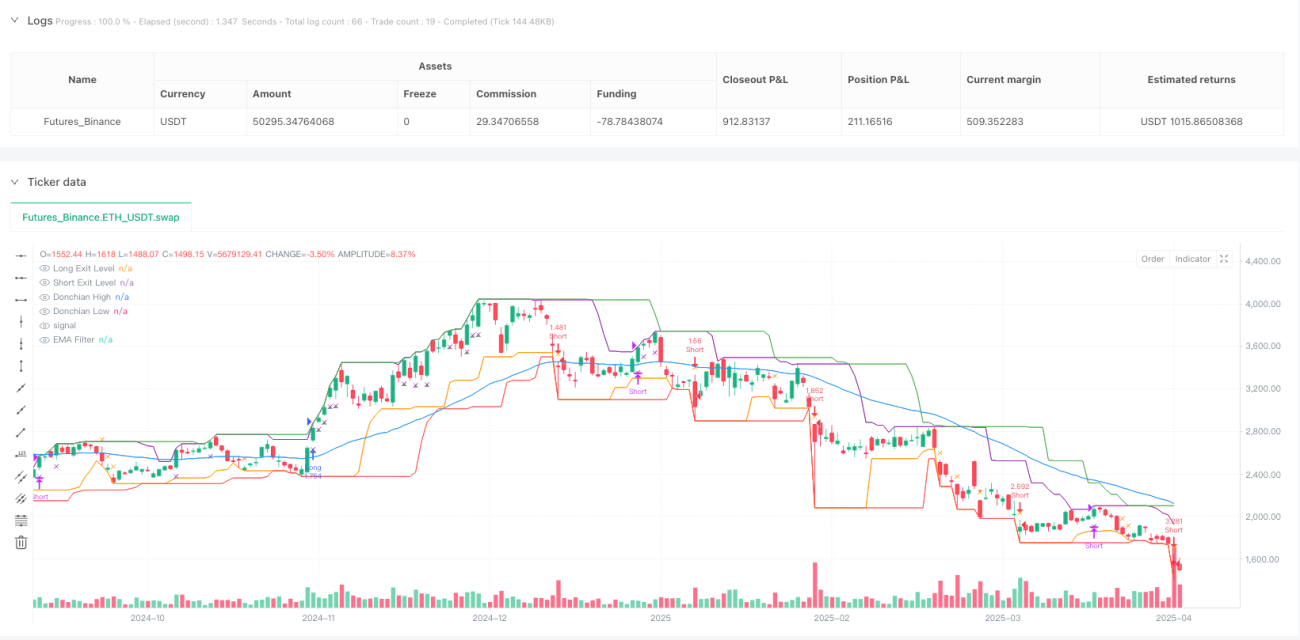
- Entry signals are based on Donchian Channel breakouts (default 20 periods), going long when price breaks above the highest point of the previous 20 periods, and short when breaking below the lowest point.
- Trend filtering uses a 50-period EMA, ensuring trades only in the direction of the trend - only long positions when price is above the EMA, only short positions when below.
- Momentum confirmation is implemented through a 14-period RSI, confirming bullish momentum when RSI is greater than 50, and bearish momentum when less than 50.
- The intelligent stop-loss mechanism employs volatility-based dynamic adjustment using ATR, defaulting to a distance of 1.5 times ATR, allowing stop-losses to automatically adjust with market volatility.
- The exit strategy combines reverse breakouts of the Donchian Channel (10 periods) with ATR stop-losses for dual protection, both preserving profits and limiting losses.
- An optional volatility filter requires the current ATR to be above its 20-period SMA, avoiding trades in low volatility ranges.
- An optional volume filter requires the current volume to be above its 20-period SMA, ensuring sufficient market participation.
When executing the strategy, the system automatically calculates all conditions, only opening positions when all entry conditions are met, and immediately setting ATR-based dynamic stop-loss levels. The strategy automatically closes positions when the price reaches either the reverse channel or the stop-loss level.
Strategy Advantages
Through deep analysis of the strategy's code structure and logic, the following significant advantages can be summarized:
-
Strong Trend Adaptability: Through the combination of Donchian Channels and EMA, the strategy can effectively capture trends across various timeframes and automatically adapt to different market environments.
-
Multi-layer Filtering Mechanism: By integrating EMA, RSI, volatility, and volume as multi-dimensional filtering conditions, the strategy significantly reduces false breakout signals and improves trade quality.
-
Intelligent Risk Management: The ATR-based dynamic stop-loss mechanism allows the strategy to automatically adjust stop-loss distances according to current market volatility, achieving an intelligent balance between risk and reward.
-
High Configurability: All key parameters can be customized, allowing traders to flexibly adjust the strategy according to different market conditions and personal risk preferences.
-
Dual Exit Protection: The combination of trend reversal signals (channel reverse breakouts) and absolute stop-loss levels provides dual insurance, effectively locking in profits while strictly controlling risk.
-
Adaptive Commission Model: Built-in realistic commission calculation (default 0.045%) ensures backtesting results more closely approximate actual trading situations.
-
Visualized Trading Signals: The strategy provides comprehensive graphical indicators, including entry and exit signals and various indicator lines, helping traders intuitively understand trading logic and market conditions.
Strategy Risks
Despite the strategy's comprehensive design, the following potential risks and limitations exist:
-
Range-bound Market Risk: Despite multiple filtering mechanisms, in long-term sideways markets, the strategy may still produce consecutive small losing trades. The solution is to increase volatility thresholds or introduce additional market structure assessment indicators.
-
Parameter Sensitivity: Different parameter combinations significantly impact strategy performance, especially the selection of channel length and EMA periods. It is recommended to seek optimal parameter combinations through historical data backtesting and forward validation.
-
Systemic Risk Exposure: During severe market volatility or major event shocks, prices may gap significantly beyond stop-loss levels, causing actual losses to exceed expectations. It is recommended to set maximum risk exposure limits and restrict the percentage of funds per trade.
-
Slippage and Liquidity Risk: The code does not account for slippage and liquidity issues; in live trading, especially with small-cap assets, execution price deviations may occur. It is recommended to add slippage simulation and adjust entry volume for low-liquidity markets.
-
Overoptimization Risk: Excessive parameter optimization may cause the strategy to only adapt to historical data while losing future adaptability. Sample-out testing and robustness analysis are recommended to verify parameter universality.
Strategy Optimization Directions
Based on code analysis, the following are directions for further optimization of this strategy:
-
Adaptive Parameter Adjustment: Introduce adaptive mechanisms to dynamically adjust channel length and filtering conditions based on market state (high/low volatility periods, trending/ranging periods), improving the strategy's adaptability across different market environments.
-
Multi-timeframe Confirmation: Add trend confirmation mechanisms from higher timeframes to ensure trading direction aligns with the major trend, reducing counter-trend trading risk.
-
Dynamic Position Management: The current strategy uses fixed proportion fund management (10%) and could be optimized to an ATR-based volatility-adjusted position model, increasing positions during low volatility periods and decreasing during high volatility periods, optimizing the risk-reward ratio.
-
Advanced Exit Mechanisms: Implement partial profit-taking mechanisms, such as closing positions in batches when reaching certain profit targets, both capturing major trends and securing partial profits promptly.
-
Market State Classification: Introduce market state determination mechanisms (such as volatility analysis or trend strength analysis) to apply different parameter sets in different market states, further reducing losses in ranging markets.
-
Machine Learning Enhancement: Combine machine learning algorithms to optimize parameter selection and entry timing judgments, especially using pattern recognition technology to reduce false breakout trades.
-
Sentiment Indicator Integration: Introduce market sentiment indicators such as volume anomalies and price volatility anomalies to help identify potential trend turning points and adjust position strategies in advance.
Summary
The Multi-Indicator Trend Breakout Strategy with Dynamic Stop-Loss is a comprehensive trading system that fuses traditional Turtle Trading rules with modern technical analysis. By integrating Donchian Channel breakouts, EMA trend confirmation, RSI momentum verification, and ATR dynamic stop-losses, this strategy builds a trading framework that both captures major trends and effectively manages risk.
The strategy's greatest advantage lies in its multi-layer filtering mechanism and intelligent risk management system, significantly improving the reliability of traditional breakout systems. By providing highly configurable parameters and clear entry and exit rules, this strategy is suitable both for experienced traders making fine adjustments and for beginners as a good starting point for systematic trading.
Although all trading strategies have risks and limitations, the solid framework and clear optimization paths provided by this strategy offer traders a powerful tool for building reliable quantitative trading systems across different market environments. Through continuous optimization and adaptation to market changes, this strategy has the potential to become a long-term stable profitable trading system.
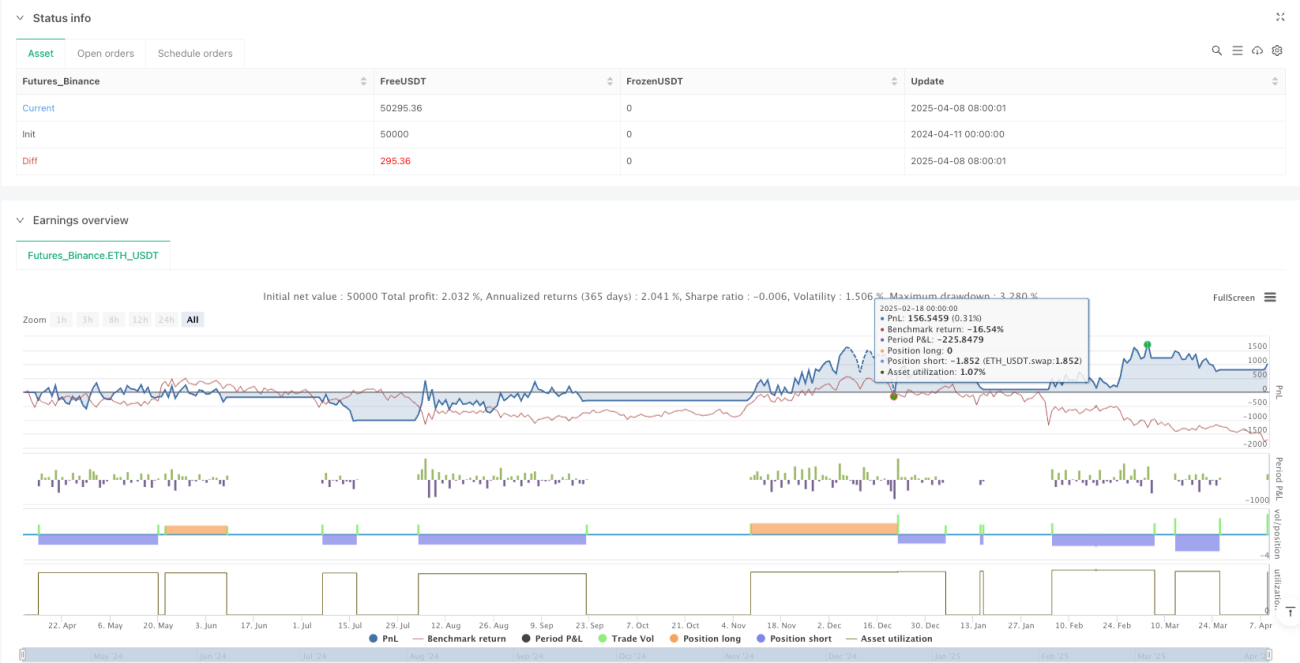
/*backtest
start: 2024-04-11 00:00:00
end: 2025-04-09 08:00:00
period: 1d
basePeriod: 1d
exchanges: [{"eid":"Futures_Binance","currency":"ETH_USDT"}]
*/

//@version=5
strategy("Donchian Breakout Strategy", overlay=true, default_qty_type=strategy.percent_of_equity, default_qty_value=10, commission_type=strategy.commission.percent, commission_value=0.045)

// === Inputs ===- 1