
Overview
The Multi-Indicator Crossover Momentum Trend-Following Strategy is a high-precision quantitative trading system that combines the Hull Moving Average (HMA) with a shifted Exponential Moving Average (EMA), integrated with the Relative Strength Index (RSI) and dual Stochastic Oscillators as momentum filters. This strategy aims to capture high-probability trend breakouts, achieve precise entries and exits, while providing strict risk management mechanisms. The core logic is based on moving average crossover signals, confirmed by multiple momentum indicators to reduce false breakouts and improve trading win rates.
Strategy Principles
This strategy is built on several key technical components:
-
Hull Moving Average (HMA) and Shifted EMA Crossover: The strategy uses a 12-period Hull Moving Average and a 5-period EMA shifted forward by 2 bars as the primary signal generation mechanism. HMA is known to react faster than traditional moving averages, while the shifted EMA adds a predictive quality, allowing earlier detection of trend changes.
-
Multi-layer Momentum Filtering: The strategy incorporates RSI(14) and two Stochastic Oscillators with different parameter settings (12,3,3 and 5,3,3) as confirmation indicators. This multi-layer filtering mechanism ensures that trade signals are triggered only when the trend has sufficient momentum.
-
Precise Entry Conditions:
- Long Entry: Price closes above both HMA and shifted EMA, RSI is above 50, both Stochastic Oscillators' %K values are above 50, and HMA crosses above the shifted EMA.
- Short Entry: Price closes below both HMA and shifted EMA, RSI is below 50, both Stochastic Oscillators' %K values are below 50, and HMA crosses below the shifted EMA.
-
Strict Risk Management: Stop-loss is set at the lowest point (for longs) or highest point (for shorts) of the previous 2 candles, with take-profit set at 1.65 times the stop-loss distance, creating a favorable risk-reward ratio.
The logic behind the strategy is that high-probability trading signals form only when price, moving averages, and multiple momentum indicators all confirm the same direction, thus reducing the impact of market noise.
Strategy Advantages
-
Comprehensive Multi-Confirmation: By combining moving average crossovers with confirmation from multiple momentum indicators, the strategy significantly reduces the probability of false signals, improving trading precision.
-
Quick Response to Market Changes: The use of Hull Moving Average allows the strategy to adapt to price movements faster than traditional moving averages, while the shifted EMA adds a predictive element.
-
Strong Adaptability: The combination of multiple indicators enables the strategy to adapt to different market environments, including trending and range-bound conditions.
-
Clear Risk Management: Predefined stop-loss and take-profit levels provide clear risk control for each trade, with the 1.65 risk-reward ratio supporting long-term profitability.
-
Visual Intuitiveness: The strategy provides clear buy and sell signal arrows and displays RSI and Stochastic Oscillator values in the strategy panel, allowing traders to visually understand and verify trading signals.
-
Commission Consideration: The strategy code includes commission calculations, making backtesting results closer to actual trading conditions.
Strategy Risks
-
Over-Optimization Risk: The combination of multiple indicators may lead to overfitting on specific historical data, potentially performing poorly in future markets. It is recommended to validate with longer backtesting periods and different market environments.
-
Lag Risk: Despite the reduced lag from Hull Moving Average and shifted EMA, all technical indicators inherently have some delay, which may cause missed crucial turning points in rapidly reversing markets.
-
Parameter Sensitivity: The strategy uses multiple fixed parameters (such as HMA's 12-period, EMA's 5-period), which may significantly impact performance across different markets and timeframes. Parameter sensitivity analysis is recommended.
-
Market Condition Dependency: This strategy may perform better in clear trending markets but might generate more false signals in sideways, consolidating markets. Traders need to adjust their use of the strategy based on current market conditions.
-
Stop-Loss Trigger Risk: Using the extremes of the previous 2 candles as stop-loss points might lead to overly wide stops in highly volatile markets, increasing risk exposure per trade.
Solutions include: using adaptive parameters based on market volatility, adding market environment filters to avoid trading in unsuitable market conditions, and considering dynamic stop-loss mechanisms.
Strategy Optimization Directions
-
Adaptive Parameter Adjustment: Introduce adaptive mechanisms to automatically adjust HMA and EMA periods based on market volatility. For example, use shorter periods in low-volatility markets and longer periods in high-volatility markets to adapt to different market conditions.
-
Market Environment Filtering: Add market environment assessment logic, such as using ATR (Average True Range) or volatility indicators to identify market states and only trade in environments suitable for the strategy.
-
Dynamic Risk Management: Replace the fixed 1.65 risk-reward ratio with a mechanism that dynamically adjusts based on market volatility, such as using higher risk-reward ratios in low-volatility markets and more conservative settings in high-volatility markets.
-
Add Trend Strength Filtering: Introduce trend strength indicators like ADX (Average Directional Index) and only trade when the trend is strong enough, avoiding frequent trading in weak trend or range-bound markets.
-
Time Filters: Add time filtering functionality to avoid important economic data release periods or low-liquidity sessions, reducing false signals caused by irregular market movements.
-
Partial Position Management: Implement a mechanism for scaling in and out of positions rather than entering and exiting all at once, which can reduce timing risk and optimize overall risk-reward performance.
-
Machine Learning Enhancement: Consider using simple machine learning algorithms to optimize parameter selection or enhance predictive capabilities, such as using regression models to predict optimal parameter combinations.
The core objective of these optimization directions is to improve the strategy's adaptability and robustness, reducing dependence on specific parameters and market conditions, thereby creating a trading system that maintains stable performance across different market environments.
Summary
The Multi-Indicator Crossover Momentum Trend-Following Strategy is a well-designed quantitative trading system that achieves efficient trend capture and strict risk management through the combination of Hull Moving Average, shifted EMA, and multi-layer momentum indicators. The strategy's main advantages lie in its multiple confirmation mechanisms that reduce false signals, while clear risk management rules provide a consistent trading framework.
However, like all trading strategies, it faces inherent challenges such as parameter optimization and market adaptability issues. By introducing adaptive parameters, market environment filtering, and dynamic risk management optimizations, the strategy's robustness and long-term performance can be further enhanced.
Ultimately, this strategy provides trend-following traders with a trading system foundation that is technically comprehensive and logically clear. By understanding its principles and making appropriate adjustments for specific trading needs, traders can develop it into a personalized, efficient trading tool. Successful quantitative trading depends not only on the technical design of the strategy but also on strict execution discipline and continuous optimization improvements.
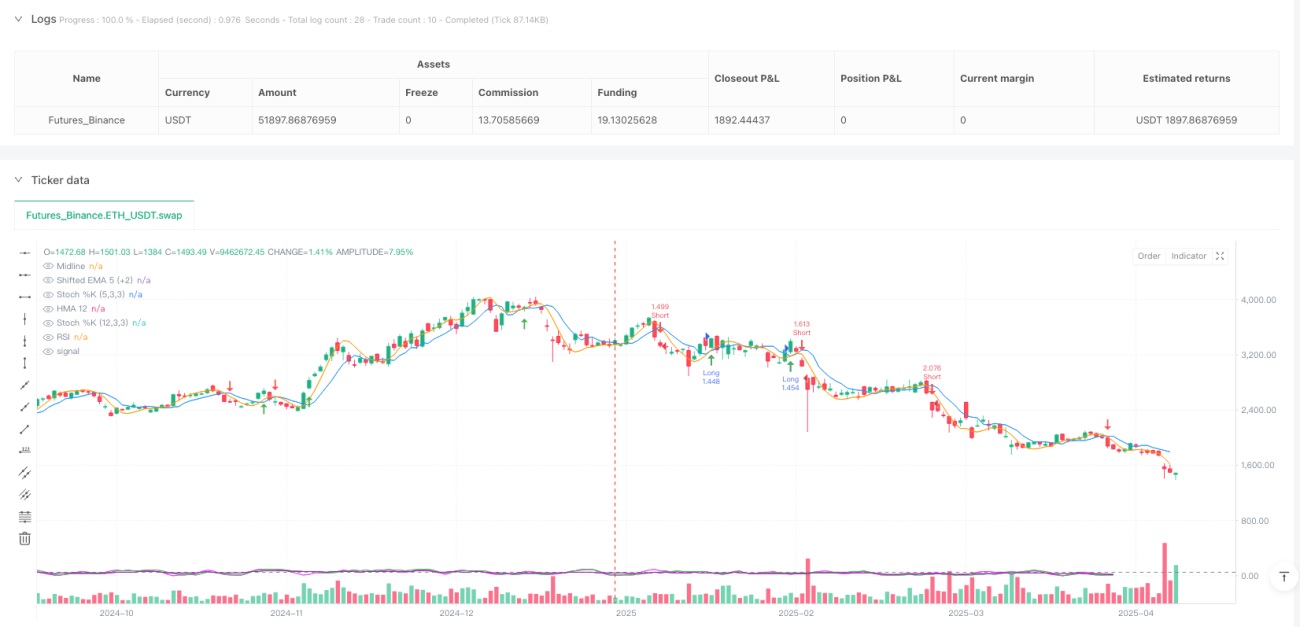
/*backtest
start: 2025-01-01 00:00:00
end: 2025-04-10 00:00:00
period: 1d
basePeriod: 1d
exchanges: [{"eid":"Futures_Binance","currency":"ETH_USDT"}]
*/

//@version=5
strategy("TrendTwisterV1.5 (Forex Ready + Indicators)", overlay=true, default_qty_type=strategy.percent_of_equity, default_qty_value=10, commission_type=strategy.commission.percent, commission_value=0.01)

// === Parameters ===- 1