
Overview
The Dynamic EMA Trend Detection with ATR Threshold Strategy is a trend-following system that combines Exponential Moving Averages (EMA), Average True Range (ATR), and Average Directional Index (ADX). The strategy determines market trend direction through the difference between two EMAs and utilizes a dynamic ATR-based threshold (adjusted by ADX) to identify when the market enters bullish (blue) or bearish (pink) zones. It enters long positions when the fast EMA exceeds the dynamic threshold and exits when it falls below the threshold, providing clear, rule-based signals for trend-following trades.
Strategy Principles
The strategy is built upon three key technical indicators: Exponential Moving Averages (EMA), Average True Range (ATR), and Average Directional Index (ADX).
First, the strategy calculates two EMAs of different periods (default 30 and 60) and measures the difference between them (emaDiff). This difference reflects the strength and direction of short-term price movements relative to medium-term price movements.
Second, the strategy implements a custom ADX calculation to measure the strength of market trends. An ADX value above the set threshold (default 20) indicates a strong trending market environment, while below this threshold indicates a weak trend or sideways market.
Third, the strategy dynamically adjusts the ATR multiplier based on the ADX value: using a larger ATR multiplier (default 0.3) in strong trending environments and a smaller ATR multiplier (default 0.1) in weak trending environments.
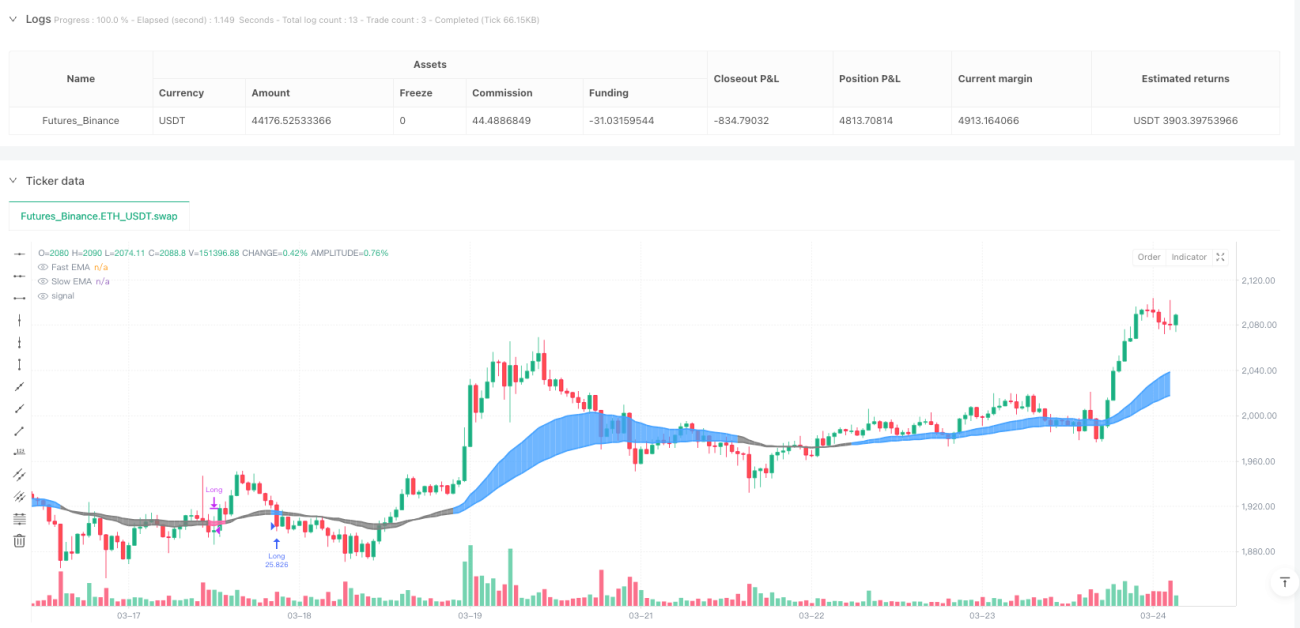
By comparing emaDiff with the dynamically adjusted ATR threshold (dynamicAtrMult * ATR), the strategy determines whether the market is in a bullish zone (emaDiff > dynamic threshold) or bearish zone (emaDiff < -dynamic threshold). When the market transitions from a bearish to a bullish zone, the strategy enters a long position; when the market transitions from a bullish to a bearish zone, the strategy exits the position.
The strategy also provides intuitive visual feedback through color coding: blue for bullish zones, pink for bearish zones, and gray for neutral zones.
Strategy Advantages
-
Adaptive Dynamic Thresholding: The strategy employs an ATR-based dynamic threshold that automatically adjusts to market volatility. In highly volatile markets, the threshold increases to reduce false signals; in low volatility markets, the threshold decreases to enhance sensitivity.
-
Trend Strength Adjustment: By incorporating ADX into the ATR multiplier calculation, the strategy further optimizes the threshold based on trend strength. It uses higher thresholds in strong trending environments to reduce noise and lower thresholds in weak trending environments to capture subtle changes.
-
Visual Clarity: The strategy provides intuitive color-coded visual feedback, allowing traders to quickly identify the current market state and potential trading opportunities.
-
Clear Rules: The strategy generates entry and exit signals based on explicit rules, eliminating subjectivity in trading decisions.
-
Built-in Risk Management: The strategy automatically exits positions when the market reverses, providing an inherent risk management mechanism.
Strategy Risks
-
Lag Issues: As the strategy is based on moving averages, it is inherently lagging. In sideways or choppy markets, this lag may lead to suboptimal timing for entering or exiting positions.
-
False Breakout Risk: In highly volatile environments, prices may briefly break through the threshold and then quickly reverse, resulting in false signals and unnecessary trades.
-
Parameter Sensitivity: The strategy's performance is highly sensitive to parameters such as EMA lengths, ATR length, ADX threshold, and ATR multipliers. Improper parameter selection may lead to overtrading or missing significant trends.
-
One-Directional Trading Limitation: The current implementation only supports long positions, potentially missing opportunities in bearish or downtrending markets.
-
Trending Market Dependency: The strategy performs best in strongly trending markets and may underperform in sideways or ranging markets.
Strategy Optimization Directions
-
Add Short Trading: Extend the strategy to include short trading logic, allowing for profit in bearish markets. This can be implemented by simply adding short entry conditions in the bearish zone.
-
Filter Integration: Introduce additional filters (such as Relative Strength Index or Stochastic) to reduce false signals. For example, an RSI filter could be added to avoid trading in overbought or oversold conditions.
-
Dynamic Position Sizing: Implement dynamic position sizing based on ATR or ADX values, increasing position size in strong trends and reducing it in weak trends or highly volatile environments.
-
Parameter Optimization Framework: Develop a framework for automatically optimizing parameters like EMA lengths, ATR multipliers, and ADX thresholds across different market conditions.
-
Add Stop-Loss Mechanism: Introduce ATR-based stop losses to limit potential losses on individual trades, improving overall risk-adjusted returns.
-
Implement Profit Targets: Implement partial profit-taking mechanisms, such as closing a portion of the position when specific profit targets are reached, to lock in profits and reduce drawdowns.
Summary
The Dynamic EMA Trend Detection with ATR Threshold Strategy is a thoughtfully designed trend-following system that leverages a combination of EMA, ATR, and ADX to generate trading signals that adapt to market volatility and trend strength. By dynamically adjusting the ATR threshold, the strategy maintains adaptability across different market environments, providing a systematic approach to identifying potential trend-following opportunities.
While the strategy may face challenges in sideways or highly volatile markets, with the suggested optimizations (such as adding short trading, integrating additional filters, and implementing stop-loss mechanisms), it can be further enhanced to address various market conditions. Ultimately, the strategy provides a solid foundation for traders seeking a rule-based trend-following system that is both adaptive and easy to understand.
/*backtest
start: 2025-03-11 00:00:00
end: 2025-03-25 00:00:00
period: 1h
basePeriod: 1h
exchanges: [{"eid":"Futures_Binance","currency":"ETH_USDT"}]
*/

//@version=6
strategy("OneTrend EMA", overlay=true, default_qty_type=strategy.percent_of_equity, default_qty_value=100, initial_capital = 10000)

// ——— USER INPUTS ———- 1