
Overview
The Five-Minute Trend Breakthrough Momentum Trading Strategy is a short-term trading system based on multiple technical indicators, specifically designed for short-term market fluctuations. This strategy utilizes a combination of moving averages (EMA and SMA), Volume Weighted Average Price (VWAP), and Relative Strength Index (RSI) signals to determine entry points. Through strict multi-conditional filtering, this strategy aims to capture short-term momentum shifts in the market and execute trades under clearly defined stop-loss and profit conditions, achieving controlled-risk short-term profits. It is particularly suitable for high-volatility market environments, effectively filtering out market noise and capturing genuinely promising short-term trend opportunities.
Strategy Principles
The core principle of this strategy is to identify strong short-term trend momentum through multi-dimensional technical indicator verification. Specifically:
-
Entry Signal Determination:
-
Call (Long) Signal: Must simultaneously satisfy four conditions:
- 5-minute candle close above the 21-period SMA high
- Close above VWAP
- Close above the 50-period EMA
- RSI indicator above 60
-
Put (Short) Signal: Must simultaneously satisfy four conditions:
- 5-minute candle close below the 21-period SMA low
- Close below VWAP
- Close below the 50-period EMA
- RSI indicator below 40
-
-
Exit Logic:
- Stop Loss Conditions: For long trades, exit when the closing price falls below the 21-period SMA low; for short trades, exit when the closing price rises above the 21-period SMA high
- Take Profit Conditions: Automatically calculated based on the risk-reward ratio (default 1.5), i.e., the profit target is 1.5 times the stop loss distance
-
State Tracking:
- Strategy tracks current trading status through variables like inTrade, isCall
- Uses labels to display entry, stop loss, and take profit levels
- Periodically updates trade status labels
-
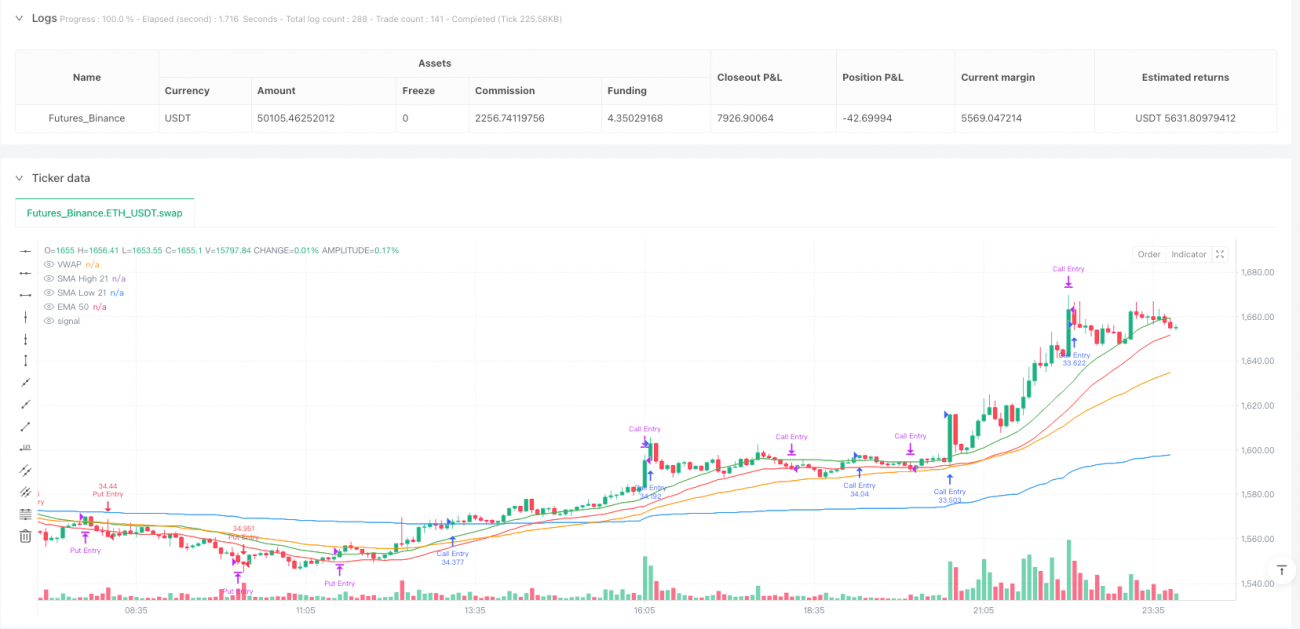
Chart Elements:
- Displays 50-period EMA, 21-period SMA highs and lows, and VWAP, providing intuitive technical analysis references
This strategy enhances signal reliability through multi-indicator resonance confirmation and combines precise risk management mechanisms to achieve an efficient short-term trading system.
Strategy Advantages
-
Multiple Confirmation Mechanism: The strategy requires multiple technical indicators to simultaneously meet conditions before triggering a trade signal, significantly reducing the risk of false signals. This "resonance" effect effectively filters out market noise and improves trade quality.
-
Clear Risk Management: The strategy incorporates explicit stop-loss conditions and automatically calculates take-profit targets based on risk-reward ratios, making the risk and reward expectations visible for each trade. The default 1.5x risk-reward ratio ensures a probability advantage for long-term profitability.
-
Adaptation to Short-term Market Fluctuations: The five-minute timeframe setting is particularly suitable for intraday traders, capturing short-term market momentum changes while avoiding overtrading.
-
Visualized Trading Status: The strategy uses labels and chart elements to intuitively display trading status and key technical levels, helping traders understand strategy execution in real-time.
-
Flexible Parameter Settings: The period lengths of major indicators (EMA, SMA, RSI) and risk-reward ratio can all be customized, allowing the strategy to adapt to different market conditions and personal risk preferences.
-
Comprehensive Alert Conditions: The strategy sets up six different alert conditions, including entry signals, stop-loss triggers, and take-profit achievements, facilitating real-time tracking and management of trades.
Strategy Risks
-
False Breakout Risk: In oscillating markets, prices may temporarily break through technical indicators and then quickly retreat, leading to false signals. Solution: Consider adding confirmation periods, such as requiring prices to maintain above/below indicators for a certain time before triggering signals.
-
Over-optimization Risk: The strategy relies on multiple technical indicators and precise parameter settings, presenting the possibility of overfitting historical data. Solution: Test the strategy under different market conditions and timeframes to ensure robustness.
-
Slippage and Execution Delay: Short-term strategies at the five-minute level require high execution speed and may face slippage and delay issues in actual trading. Solution: Set appropriate order types (such as limit orders rather than market orders) and consider adding buffer zones.
-
Sudden Trend Reversals: Short-term momentum can be quickly reversed by breaking news or market events. Solution: Consider setting maximum loss limits and avoid trading during important data releases or events.
-
Excessive Trading Frequency: High-volatility markets may generate too many signals, increasing trading costs. Solution: Add additional filtering conditions, such as trade interval time limits or stricter entry conditions.
-
Single Timeframe Dependency: Relying solely on 5-minute charts may miss important trend information from larger timeframes. Solution: Consider adding filtering conditions from higher timeframes to ensure consistency with larger trends.
Strategy Optimization Directions
-
Multi-timeframe Analysis Integration: The current strategy is based solely on the 5-minute timeframe. Consider adding trend confirmation from higher timeframes (such as 15-minute, 1-hour). This can improve signal quality and avoid trading against the major trend. For example, only execute trades when the 15-minute trend aligns with the 5-minute signal direction.
-
Dynamic Parameter Adjustment: Parameters can be automatically adjusted based on market volatility. For example, extend moving average periods or raise RSI thresholds in high-volatility environments, and shorten periods or lower thresholds in low-volatility environments. This will make the strategy more adaptive.
-
Volume and Market Structure Analysis: Integrating volume analysis and price structures (such as support/resistance levels) can improve entry precision. In particular, signals near key price levels tend to be more meaningful.
-
Adaptive Risk-Reward Settings: The current fixed risk-reward ratio can be dynamically adjusted based on market volatility or historical performance during specific periods. This optimizes return expectations across different market phases.
-
Adding Market Environment Filters: Add logic for assessing the overall market environment, such as trend strength, volatility filters, or trading session restrictions. For example, avoid trading 30 minutes before market opening and closing, or only trade within specific volatility ranges.
-
Partial Profit Mechanism: Consider implementing a tiered profit strategy, such as closing half the position at 0.8R profit, with a trailing stop for the remainder. This protects profits while leaving room to capture larger moves.
-
Machine Learning Optimization: Utilize machine learning algorithms to analyze historical data, identify optimal parameter combinations, and additional signal confirmation features to further improve strategy prediction accuracy.
Summary
The Five-Minute Trend Breakthrough Momentum Trading Strategy is a well-designed short-term trading system that provides intraday traders with a structured framework for market analysis and decision-making through the synergy of multi-dimensional technical indicators and strict risk management. This strategy is particularly suitable for capturing short-term price momentum and helps traders maintain discipline and consistency in complex markets through clear entry and exit rules.
The core advantage of the strategy lies in its multiple indicator resonance confirmation mechanism, which effectively reduces the risk of false signals; meanwhile, the built-in risk-reward management ensures controllable trading risk. However, like any trading strategy, this one has limitations—it may face false breakout risks in oscillating markets and is sensitive to parameter selection and execution speed.
There is still considerable room for optimization by integrating multi-timeframe analysis, dynamic parameter adjustments, and more complex market environment filtering. Traders can make appropriate adjustments to parameters based on personal risk preferences and market experience, or add additional confirmation mechanisms to further enhance strategy performance.
Ultimately, successful application of this strategy requires traders to deeply understand its principles and limitations, maintain strict risk management discipline, and continuously evaluate and optimize strategy performance under different market conditions.
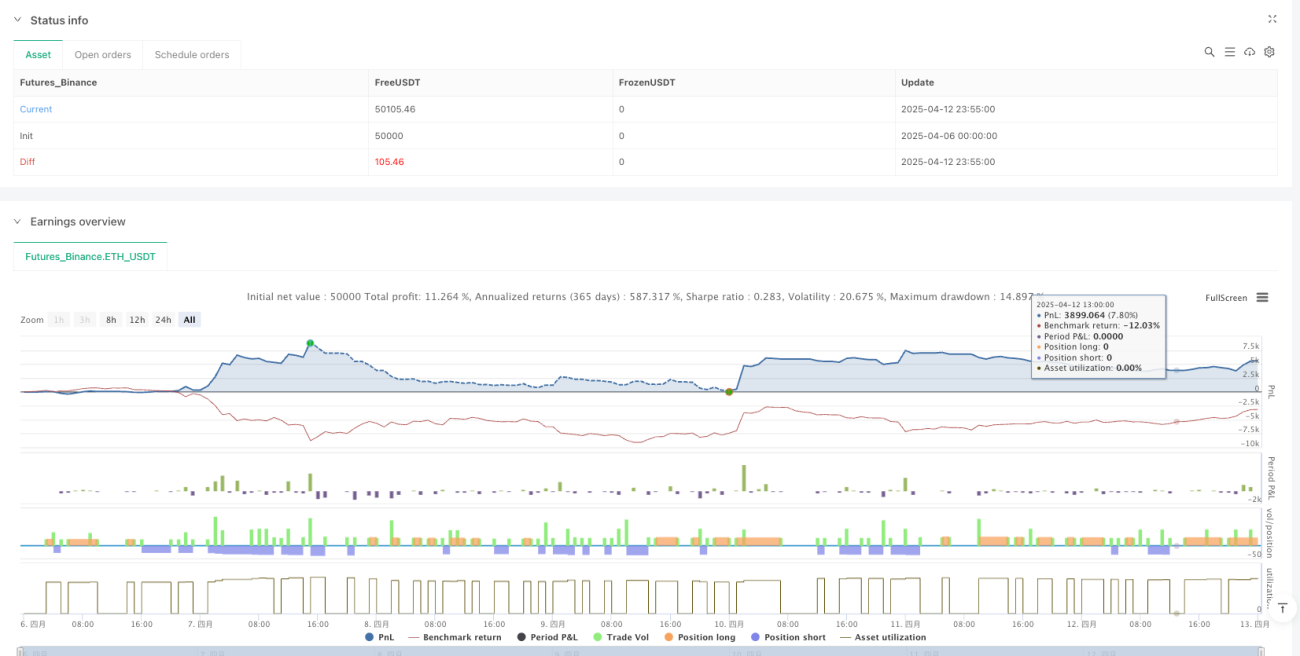
/*backtest
start: 2025-04-06 00:00:00
end: 2025-04-13 00:00:00
period: 5m
basePeriod: 5m
exchanges: [{"eid":"Futures_Binance","currency":"ETH_USDT"}]
*/

//@version=6
strategy("5-Min Call/Put Entry Strategy", overlay=true, default_qty_type=strategy.percent_of_equity, default_qty_value=100)

// ————— INPUTS —————- 1