Heiken Ashi Trend Following Strategy: Multi-Timeframe Trend Identification System with Multi-Layer Stop Loss Mechanism

supertrend ADX ATR HEIKEN ASHI DMI
Created on: 2025-04-14 11:31:37 Modified on: 2025-04-14 11:31:37
Copy: 1 Number of hits: 502
avatar of ianzeng123 ianzeng123
2
Follow
319
Followers

 Heiken Ashi Trend Following Strategy: Multi-Timeframe Trend Identification System with Multi-Layer Stop Loss Mechanism  Heiken Ashi Trend Following Strategy: Multi-Timeframe Trend Identification System with Multi-Layer Stop Loss Mechanism

Overview

The Heiken Ashi Trend Following Strategy is a comprehensive trading system that combines the strengths of Heiken Ashi candles, Supertrend indicator, and Average Directional Index (ADX) filter to identify strong trend movements and effectively manage capital. The strategy focuses on capturing momentum in established trends while employing an advanced three-layer stop loss mechanism to protect capital and secure profits. This strategy is applicable to various trading instruments, particularly excelling in markets with significant volatility.

Strategy Principle

The Heiken Ashi Trend Following Strategy is based on the synergistic action of three core technical indicators:

  1. Heiken Ashi Candle Analysis: The strategy specifically looks for “full-bodied” Heiken Ashi candles with minimal or no wicks, which indicate decisive price movement in one direction with minimal retracement, suggesting strong momentum and trend continuation. Green candles with no bottom wick are considered long signals, while red candles with no top wick are considered short signals.

  2. Supertrend Indicator Filter: The system uses the Supertrend indicator (default factor: 3.0, ATR period: 10) to confirm the underlying trend direction. Entry signals must align with the prevailing Supertrend direction, which increases signal reliability and reduces false trades.

  3. ADX Filter (Optional): The Average Directional Index is used to assess trend strength, with trades only triggering when ADX exceeds a specified threshold (default: 25), helping filter out noise signals in choppy or ranging markets.

The trading system has clear entry and exit rules: - Entry Signals: Form when the following conditions are met: (1) Green Heiken Ashi candle with no bottom wick (for long) or red candle with no top wick (for short); (2) Supertrend direction confirmation; (3) ADX threshold (if enabled). - Exit Signals: Positions are closed when either an opposing candle with no wick appears in the opposite direction, or any of the stop loss mechanisms are triggered.

The most notable feature of this strategy is its innovative triple-layer stop loss system: 1. ATR Trailing Stop: Dynamically adjusts the stop loss position based on market volatility (ATR value), locking in profits as the trend extends. 2. Swing Point Stop: Uses natural market structure (recent highs/lows over a lookback period) to place stops at logical support/resistance levels, respecting the market’s own rhythm. 3. Insurance Stop: A safety net based on a percentage of the entry price, providing immediate capital protection, particularly when the swing point stop might be positioned too far from entry.

Strategy Advantages

  1. Multi-layer Risk Management: The three-tier stop loss system provides comprehensive capital protection, adapting to different market conditions and risk scenarios, which is the most prominent advantage of this strategy.

  2. High Adaptability: All components (Supertrend, ADX) can be enabled/disabled based on different market conditions, and parameters can be adjusted, giving the strategy significant flexibility.

  3. Strong Trend Capture Capability: By combining clear visual signals from Heiken Ashi candles, confirmation from Supertrend, and trend strength assessment from ADX, the strategy can effectively identify strong trend movements.

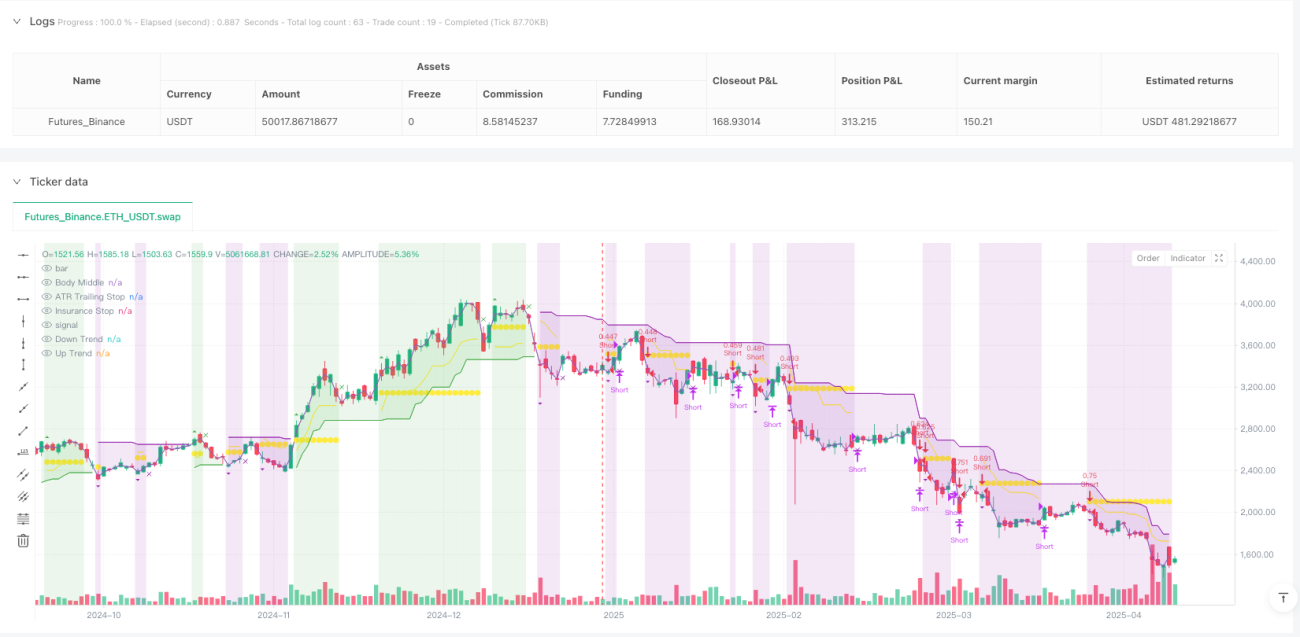
  4. Clear Visual Feedback: The strategy displays position status, entry prices, and current stop levels on the chart, allowing traders to intuitively understand and track strategy execution.

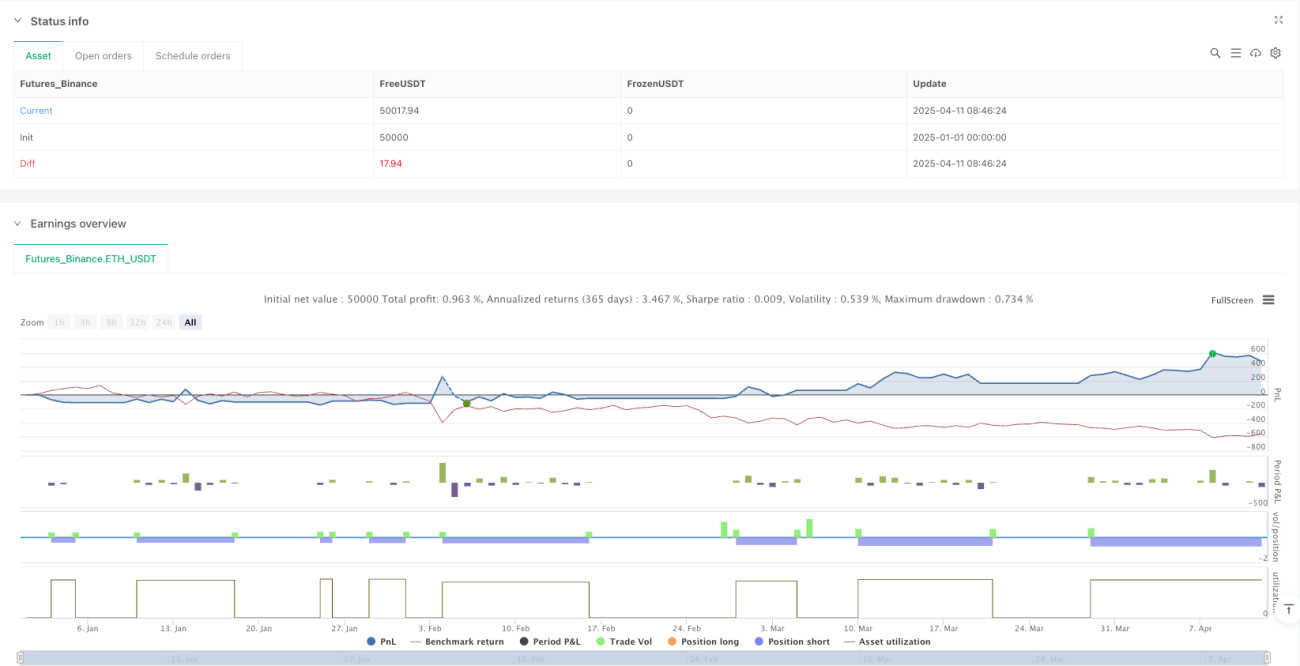
  5. Built-in Capital Management: The strategy adopts a position sizing method based on equity percentage (default: 3%), ensuring consistent risk exposure as account size changes.

  6. Complete Trading System: Provides a complete trading process from entry signals to exit rules, requiring no additional decision-making or indicators.

Strategy Risks

  1. Over-optimization Risk: The strategy includes multiple adjustable parameters, which may lead to curve-fitting issues, where the strategy performs well on historical data but poorly in live trading. The solution is to use sufficiently long historical data for backtesting and test the strategy’s robustness under different market conditions.

  2. Trend Reversal Risk: Despite having multiple stop loss mechanisms, the strategy may still face significant drawdowns when a strong trend suddenly reverses. Extreme market volatility may cause stop losses to not trigger in time, resulting in losses exceeding expectations. The solution is to consider adding volatility filters or implementing stricter risk management rules.

  3. Parameter Sensitivity: Different parameter settings may lead to drastically different results, especially the Supertrend factor and ADX threshold. This requires traders to deeply understand the impact of each parameter and find a balance point suitable for specific market environments.

  4. Poor Performance in Low Volatility Environments: In low volatility or ranging markets, the strategy may generate multiple false signals, leading to “whipsaw” trading. The solution is to pause trading in such environments or add additional market environment filters.

  5. Capital Management Risk: Fixed percentage position sizing may not be suitable for all market environments, and in highly volatile markets, it may be necessary to reduce position size to control risk.

Strategy Optimization Directions

  1. Add Volatility Adaptation Mechanism: The current strategy can be further optimized by introducing volatility filters, such as Historical Volatility (HV) or Implied Volatility (IV) indicators, to automatically adjust parameters in different market environments. This will enable the strategy to maintain stable performance during both high and low volatility periods.

  2. Integrate Time Filters: Consider adding time-based filters to avoid trading during known periods of lower volatility or weaker trend characteristics. This is particularly useful for trading specific instruments, as different instruments exhibit different behavioral characteristics at different times of the day.

  3. Introduce Machine Learning Optimization: Machine learning techniques can be used to automatically identify optimal parameter combinations rather than relying on static parameter settings. This can be done by analyzing patterns in historical data to predict which parameter settings might perform best under specific future market conditions.

  4. Add Related Market Filters: Enhance entry signals by observing the behavior of related markets or indices, such as considering overall market trends or the strength/weakness of related markets when trading specific instruments.

  5. Optimize Stop Loss Mechanisms: The current three-layer stop loss system can be further optimized, for example, by dynamically adjusting the insurance stop percentage based on volatility, or using support/resistance levels to precisely set swing point stops rather than simple lookback period highs/lows.

  6. Integrate Volume Analysis: Add volume filters in the signal confirmation process to ensure price movements are supported by sufficient trading volume, thereby improving signal reliability.

Summary

The Heiken Ashi Trend Following Strategy is a sophisticated and comprehensive trading system that focuses on capturing momentum opportunities in strong trends through a unique combination of Heiken Ashi candles, Supertrend indicator, and ADX filter. Its three-layer stop loss system provides comprehensive risk management, while its customizable parameter settings allow it to adapt to various market conditions.

The main advantages of the strategy lie in its clear visual signals, powerful trend identification capabilities, and comprehensive capital protection mechanisms. However, traders should be aware of the challenges of parameter optimization and potential limitations in low volatility environments.

By implementing the suggested optimization directions, such as adding volatility adaptation mechanisms, integrating time filters, and volume analysis, the strategy can further enhance its robustness and adaptability. Ultimately, the Heiken Ashi Trend Following Strategy represents a balanced approach, combining clear signals from technical analysis with principles of systematic risk management, providing a valuable tool for trend-following traders.

Strategy source code
/*backtest
start: 2025-01-01 00:00:00
end: 2025-04-12 08:00:00
period: 1d
basePeriod: 1d
exchanges: [{"eid":"Futures_Binance","currency":"ETH_USDT"}]
*/

//@version=5
strategy("Heiken Ashi Supertrend ADX - Strategy", overlay=true, initial_capital=1000, commission_type=strategy.commission.percent, commission_value=0, calc_on_every_tick=true, process_orders_on_close=false, default_qty_type=strategy.percent_of_equity, default_qty_value=3)


// Supertrend Settings
useSupertrend = input.bool(true, "Use Supertrend for Entries", group="Supertrend Settings")
atrPeriod = input.int(10, "ATR Period", minval=1, group="Supertrend Settings")
factor = input.float(3.0, "Supertrend Factor", minval=0.5, step=0.1, group="Supertrend Settings")

// ADX Filter Settings
useAdxFilter = input.bool(false, "Use ADX Filter", group="ADX Filter")
adxPeriod = input.int(14, "ADX Period", minval=1, group="ADX Filter")
adxThreshold = input.float(25, "ADX Threshold", minval=0, group="ADX Filter")

// Stop Loss Options
useSwingStop = input.bool(false, "Use Swing Point Stop", group="Stop Loss Options")
swingLookback = input.int(3, "Swing Lookback Periods", minval=1, maxval=20, group="Stop Loss Options")

useSafetyNetStop = input.bool(true, "Use Insurance Stop", group="Stop Loss Options")
safetyNetPercent = input.float(5.0, "Insurance Stop Loss Percent", minval=0.1, step=0.1, group="Stop Loss Options")

// Trailing Stop Loss Settings
useTrailingStop = input.bool(true, "Use ATR Trailing Stop", group="Stop Loss Options")
trailAtrMultiplier = input.float(2.0, "Trailing Stop ATR Multiplier", minval=0.1, step=0.1, group="Stop Loss Options")

// Get HA data for signals
ha_security = ticker.heikinashi(syminfo.tickerid)
[o, h, l, c] = request.security(ha_security, timeframe.period, [open, high, low, close])

// Get real price data
real_open = open
real_high = high
real_low = low
real_close = close

// Calculate Supertrend using built-in function with real price data
[supertrend, direction] = ta.supertrend(factor, atrPeriod)
supertrend := barstate.isfirst ? na : supertrend

// Determine if we're in an uptrend or downtrend based on Supertrend
isUptrend = direction < 0   // In TradingView, negative direction means uptrend
isDowntrend = direction > 0 // In TradingView, positive direction means downtrend

// Calculate ATR for visualization
atrValue = ta.atr(atrPeriod)

// Calculate ADX and Trade Logic
[diplus, diminus, adx] = ta.dmi(adxPeriod, adxPeriod)
int trade = 0
if trade == 0 and diplus > diminus
    trade := 1
else if trade == 0 and diminus > diplus
    trade := -1
else if trade == 1 and diminus > diplus
    trade := -1
else if trade == -1 and diplus > diminus
    trade := 1
else
    trade := trade[1]

// Combine with ADX Threshold
isAdxBullish = diplus > diminus and adx > adxThreshold
isAdxBearish = diminus > diplus and adx > adxThreshold

// Debug ADX Values (only if needed for development)
// plot(adx, "ADX", color=color.orange, linewidth=1)
// plot(diplus, "DI+", color=color.green, linewidth=1)
// plot(diminus, "DI-", color=color.red, linewidth=1)
// hline(adxThreshold, "ADX Threshold", color=color.gray, linestyle=hline.style_dashed)

// Check for wicks on the current candle
threshold = syminfo.mintick * 0.1
noBottomWick = math.abs(math.min(o, c) - l) <= threshold
noTopWick = math.abs(h - math.max(o, c)) <= threshold

// Identify candle color and signal conditions
isGreenCandle = c > o
isRedCandle = c < o

// KEY INTEGRATION: Color the real bars based on HA trend
bullishColor = color.green   // Green for long/bullish
bearishColor = color.purple  // Purple for short/bearish
barcolor(isGreenCandle ? bullishColor : bearishColor)

// Signal conditions for both entry and exit
longCondition = (isGreenCandle and noBottomWick and barstate.isconfirmed) and (not useSupertrend or isUptrend) and (not useAdxFilter or isAdxBullish)

shortCondition = (isRedCandle and noTopWick and barstate.isconfirmed) and (not useSupertrend or isDowntrend) and (not useAdxFilter or isAdxBearish)

exitLongCondition = isRedCandle and noTopWick and barstate.isconfirmed
exitShortCondition = isGreenCandle and noBottomWick and barstate.isconfirmed

// Calculate swing points based on real candles (not HA)
swingLow = ta.lowest(real_low, swingLookback)
swingHigh = ta.highest(real_high, swingLookback)

// Position tracking
var int position = 0  // 0 = no position, 1 = long, -1 = short
var float entryPrice = na
var float trailStopLevel = na  // For ATR trailing stop
var float swingStopLevel = na  // For swing point stop
var float safetyNetStopLevel = na  // For safety net stop
var float highestSinceEntry = na  // For tracking highest price since entry (for long positions)
var float lowestSinceEntry = na   // For tracking lowest price since entry (for short positions)

// Alert variables
var bool longAlert = false
var bool shortAlert = false
var bool exitLongAlert = false
var bool exitShortAlert = false

// Reset alerts each bar
longAlert := false
shortAlert := false
exitLongAlert := false
exitShortAlert := false

// Handle entries and exits
if longCondition and (position <= 0)
    if position < 0
        exitShortAlert := true
        strategy.close("Short", comment="Exit Short")
        position := 0
    longAlert := true
    strategy.entry("Long", strategy.long, comment="Enter Long")
    position := 1
    entryPrice := real_close
    highestSinceEntry := real_close
    lowestSinceEntry := na
    // Initialize trailing stops
    if useTrailingStop
        trailStopLevel := real_close - (atrValue * trailAtrMultiplier)
    // Initialize swing point stop
    if useSwingStop
        swingStopLevel := swingLow
    // Initialize safety net stop
    if useSafetyNetStop
        safetyNetStopLevel := real_close * (1 - safetyNetPercent / 100)
        
if shortCondition and (position >= 0)
    if position > 0
        exitLongAlert := true
        strategy.close("Long", comment="Exit Long")
        position := 0
    shortAlert := true
    strategy.entry("Short", strategy.short, comment="Enter Short")
    position := -1
    entryPrice := real_close
    highestSinceEntry := na
    lowestSinceEntry := real_close
    // Initialize trailing stops
    if useTrailingStop
        trailStopLevel := real_close + (atrValue * trailAtrMultiplier)
    // Initialize swing point stop
    if useSwingStop
        swingStopLevel := swingHigh
    // Initialize safety net stop
    if useSafetyNetStop
        safetyNetStopLevel := real_close * (1 + safetyNetPercent / 100)

if position > 0 and exitLongCondition
    exitLongAlert := true
    strategy.close("Long", comment="Exit Long Signal")
    position := 0
    trailStopLevel := na
    swingStopLevel := na
    safetyNetStopLevel := na
    highestSinceEntry := na

if position < 0 and exitShortCondition
    exitShortAlert := true
    strategy.close("Short", comment="Exit Short Signal")
    position := 0
    trailStopLevel := na
    swingStopLevel := na
    safetyNetStopLevel := na
    lowestSinceEntry := na

// Check for swing point stop hit
if useSwingStop and position != 0 and not na(swingStopLevel)
    // For long positions, check if price drops below the swing low
    if position > 0 and real_low <= swingStopLevel
        strategy.close("Long", comment="Swing Point Stop Hit")
        position := 0
        trailStopLevel := na
        swingStopLevel := na
        safetyNetStopLevel := na
        highestSinceEntry := na
        
    // For short positions, check if price rises above the swing high
    else if position < 0 and real_high >= swingStopLevel
        strategy.close("Short", comment="Swing Point Stop Hit")
        position := 0
        trailStopLevel := na
        swingStopLevel := na
        safetyNetStopLevel := na
        lowestSinceEntry := na

// Check for safety net stop loss hit
if useSafetyNetStop and position != 0 and not na(safetyNetStopLevel)
    // For long positions, check if price drops below the safety net level
    if position > 0 and real_low <= safetyNetStopLevel
        strategy.close("Long", comment="Safety Net Stop Hit")
        position := 0
        trailStopLevel := na
        swingStopLevel := na
        safetyNetStopLevel := na
        highestSinceEntry := na
        
    // For short positions, check if price rises above the safety net level
    else if position < 0 and real_high >= safetyNetStopLevel
        strategy.close("Short", comment="Safety Net Stop Hit")
        position := 0
        trailStopLevel := na
        swingStopLevel := na
        safetyNetStopLevel := na
        lowestSinceEntry := na

// Track highest/lowest prices for trailing stop calculation
if position > 0 and not na(highestSinceEntry)
    highestSinceEntry := math.max(highestSinceEntry, real_high)
    
if position < 0 and not na(lowestSinceEntry)
    lowestSinceEntry := math.min(lowestSinceEntry, real_low)

// Update and check trailing stop (ATR-based)
if useTrailingStop and position != 0 and not na(trailStopLevel)
    // Update trailing stop level for long positions
    if position > 0
        // Calculate new potential trailing stop level
        trailStopNew = real_close - (atrValue * trailAtrMultiplier)
        // Only move the stop up, never down
        if trailStopNew > trailStopLevel
            trailStopLevel := trailStopNew
        // Check if price hit stop
        if real_low <= trailStopLevel
            strategy.close("Long", comment="ATR Trailing Stop Hit")
            position := 0
            trailStopLevel := na
            swingStopLevel := na
            safetyNetStopLevel := na
            highestSinceEntry := na
            
    // Update trailing stop level for short positions
    else if position < 0
        // Calculate new potential trailing stop level
        trailStopNew = real_close + (atrValue * trailAtrMultiplier)
        // Only move the stop down, never up
        if trailStopNew < trailStopLevel
            trailStopLevel := trailStopNew
        // Check if price hit stop
        if real_high >= trailStopLevel
            strategy.close("Short", comment="ATR Trailing Stop Hit")
            position := 0
            trailStopLevel := na
            swingStopLevel := na
            safetyNetStopLevel := na
            lowestSinceEntry := na

// Plot stop loss levels
plot(useTrailingStop and position != 0 ? trailStopLevel : na, "ATR Trailing Stop", color=color.yellow, style=plot.style_linebr, linewidth=1)
plot(useSwingStop and position != 0 ? swingStopLevel : na, "Swing Point Stop", color=color.red, style=plot.style_circles, linewidth=2)
plot(useSafetyNetStop and position != 0 ? safetyNetStopLevel : na, "Insurance Stop", color=color.yellow, style=plot.style_circles, linewidth=1)

// Visual signals for chart (just entry/exit markers, no ADX labels)
plotshape(longAlert, title="Long Entry", location=location.abovebar, color=bullishColor, style=shape.triangleup, size=size.small)
plotshape(shortAlert, title="Short Entry", location=location.belowbar, color=bearishColor, style=shape.triangledown, size=size.small)
plotshape(exitLongAlert, title="Long Exit Signal", location=location.abovebar, color=bullishColor, style=shape.xcross, size=size.small)
plotshape(exitShortAlert, title="Short Exit Signal", location=location.belowbar, color=bearishColor, style=shape.xcross, size=size.small)

// Supertrend visualization
bodyMiddlePlot = plot((real_open + real_close) / 2, "Body Middle", display=display.none)
upTrend = plot(useSupertrend and isUptrend ? supertrend : na, "Up Trend", color=bullishColor, style=plot.style_linebr, linewidth=1)
downTrend = plot(useSupertrend and isDowntrend ? supertrend : na, "Down Trend", color=bearishColor, style=plot.style_linebr, linewidth=1)
fill(upTrend, bodyMiddlePlot, color=useSupertrend ? color.new(bullishColor, 85) : na, title="Uptrend Background")
fill(downTrend, bodyMiddlePlot, color=useSupertrend ? color.new(bearishColor, 85) : na, title="Downtrend Background")

// Position background
bgcolor(position == 1 ? color.new(bullishColor, 85) : position == -1 ? color.new(bearishColor, 85) : na, title="Position Background")

// Position label
var label positionLabel = na
label.delete(positionLabel)
if barstate.islast
    positionText = position == 1 ? "LONG" : position == -1 ? "SHORT" : "FLAT"
    entryInfo = not na(entryPrice) ? "\nEntry: " + str.tostring(entryPrice, "#.00000") : ""
    atrStopInfo = useTrailingStop and not na(trailStopLevel) ? "\nATR Stop: " + str.tostring(trailStopLevel, "#.00000") + " (" + str.tostring(trailAtrMultiplier, "#.0") + "x ATR)" : ""
    swingStopInfo = useSwingStop and not na(swingStopLevel) ? "\nSwing Stop: " + str.tostring(swingStopLevel, "#.00000") + " (" + str.tostring(swingLookback) + " bars)" : ""
    safetyNetInfo = useSafetyNetStop and not na(safetyNetStopLevel) ? "\nInsurance Stop: " + str.tostring(safetyNetStopLevel, "#.00000") + " (" + str.tostring(safetyNetPercent, "#.0") + "%)" : ""
    supertrendInfo = useSupertrend ? "\nSupertrend: " + (isUptrend ? "UPTREND" : "DOWNTREND") : ""
    positionColor = position == 1 ? bullishColor : position == -1 ? bearishColor : color.gray
    positionLabel := label.new(bar_index, high, positionText + entryInfo + atrStopInfo + swingStopInfo + safetyNetInfo + supertrendInfo, color=positionColor, style=label.style_label_down, textcolor=color.white)