Multi-Timeframe Dynamic Momentum Wave Capture Strategy

Overview
The Multi-Timeframe Dynamic Momentum Wave Capture Strategy is a sophisticated quantitative trading approach designed for short-term traders operating on a 2-minute timeframe to efficiently capture market waves. This strategy ingeniously combines EMA channels, momentum wave indicators, and multi-timeframe confirmation mechanisms to form a comprehensive trading system. The core concept revolves around utilizing a 200 EMA-based price channel to determine the market's primary trend direction, while employing an enhanced WaveTrend indicator to capture reversal opportunities in overbought and oversold areas, with a 12 EMA serving as a precise entry signal filter. Additionally, the strategy integrates hourly trend confirmation, dynamic stop-loss settings, and risk-based position management to create a thorough and systematic trading framework.
Strategy Principles
The core principles of this strategy are based on multi-level signal confirmation and precise risk control, with specific implementation logic as follows:
-
Trend Determination Layer: The strategy applies the 200 EMA separately to high and low prices to construct a price channel, combined with hourly chart closing prices to determine the major trend direction. When the hourly closing price is above the channel, the system favors long positions; when the hourly closing price is below the channel, the system favors short positions.
-
Momentum Wave Layer: The strategy employs an enhanced WaveTrend indicator to capture market momentum changes. The WaveTrend indicator is calculated through a custom function
f_wavetrend, which includes a wave trend line (wt1) and a signal line (wt2). When the indicator reaches overbought (50) or oversold (-50) levels, the system records extreme price values and counts the duration of overbought or oversold conditions. -
Entry Confirmation Layer: The strategy combines multiple conditions to confirm entry signals:
- Long condition: Hourly price above the channel + (Oversold condition persisting for a specified number of bars or WaveTrend indicator golden cross) + Current closing price greater than 12 EMA
- Short condition: Hourly price below the channel + (Overbought condition persisting for a specified number of bars or WaveTrend indicator death cross) + Current closing price less than 12 EMA
-
Risk Management Layer: The strategy employs dynamic stop-losses and risk-based position calculation:
- Long stop-loss is set at the smaller value between the extreme low point and 200 low price EMA*0.998
- Short stop-loss is set at the larger value between the extreme high point and 200 high price EMA*1.002
- Position size is calculated by dividing the preset risk amount by the per-unit risk (difference between entry price and stop-loss price)
-
Profit Target: The system automatically sets profit target levels based on a preset risk-reward ratio (default is 3x).
Strategy Advantages
-
Multi-level Confirmation Mechanism: The strategy integrates multi-timeframe, multi-indicator confirmation mechanisms, significantly improving signal quality. By combining hourly chart trend direction with short-term momentum indicators, false signals are effectively reduced.
-
Dynamic Risk Management: Compared to fixed-point stop-loss settings, this strategy's dynamic stop-loss method better aligns with market structure, providing more reasonable risk boundaries for each trade through the combination of extreme points and moving averages.
-
Precise Position Control: The strategy adopts a position calculation method based on fixed risk amounts, maintaining consistent risk exposure regardless of market volatility changes, effectively preventing excessive losses in individual trades.
-
Strong Adaptability: Through parametric design, the strategy can adapt to different market environments. Users can adjust EMA lengths, overbought/oversold thresholds, risk amounts, and risk-reward ratios to better suit specific markets.
-
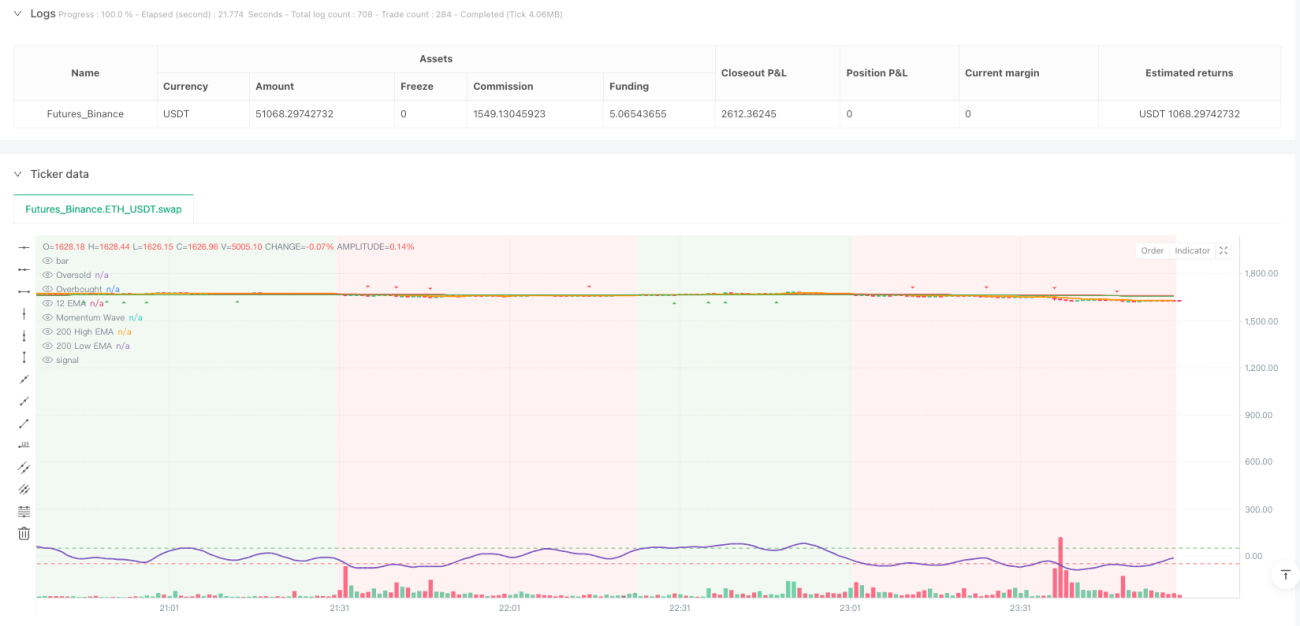
Visual Assistance: The strategy provides rich visualization elements, including EMA channels, momentum waveforms, trend background colors, and entry markers, helping traders more intuitively understand market conditions and strategy logic.
Strategy Risks
Despite its multiple advantages, the strategy still has the following potential risks:
-
Trend Reversal Risk: Although the strategy uses hourly trend confirmation, markets may experience sharp reversals under major news or black swan events, causing stop-losses to be quickly triggered. The solution is to pause trading before important economic data or news releases, or to add additional volatility filters.
-
Low Liquidity Risk: In markets or time periods with lower trading volume, increased slippage or difficulty in execution may occur, affecting strategy performance. It is recommended to use this strategy during main trading sessions and avoid instruments with poor market liquidity.
-
Parameter Optimization Risk: Excessive parameter optimization may lead to a strategy that performs excellently in historical testing but poorly in live trading. Forward validation methods and robustness tests are recommended to assess parameter reliability and avoid overfitting.
-
Consecutive Loss Risk: Despite strict risk control, consecutive losses may still occur, especially in range-bound markets. It is advisable to set limits on maximum daily losses and maximum consecutive losing trades, pausing trading to reassess market conditions when necessary.
-
Technical Dependency Risk: The strategy relies on technical indicators such as EMA and WaveTrend, which may fail under certain market conditions. Consider adding fundamental filters or other non-correlated indicators to improve strategy robustness.
Strategy Optimization Directions
Based on in-depth analysis of the strategy code, optimization can be pursued in the following areas:
-
Time Filter Introduction: The current strategy does not consider trading time factors. Time filters could be added to avoid high volatility periods at market open and close, or to focus on specific efficient trading sessions.
-
Dynamic Parameter Adaptation: Overbought/oversold thresholds and confirmation bar counts could be automatically adjusted according to market volatility, maintaining optimal performance across different market environments. For example, ATR indicators could be used to adjust thresholds—raising them in high-volatility markets and lowering them in low-volatility markets.
-
Multi-indicator Comprehensive Scoring: Besides the existing WaveTrend indicator, auxiliary indicators such as RSI, MACD, or CCI could be introduced to establish a comprehensive scoring system, triggering trading signals only when multiple indicators reach consensus.
-
Dynamic Profit Target Adjustment: The current strategy uses a fixed risk-reward ratio to set profit targets. Consider dynamic profit targets based on support/resistance levels or volatility to better adapt to market structure.
-
Partial Profit Mechanism: Add a scaled exit mechanism to secure partial profits when reaching certain profitability levels, while holding remaining positions to capture larger movements, balancing risk control and profit maximization.
-
Trading Cost Optimization: The strategy does not account for trading costs. Adding slippage and commission settings and optimizing entry logic to reduce unnecessary trading frequency could improve net profit performance.
Summary
The Multi-Timeframe Dynamic Momentum Wave Capture Strategy is a well-structured, logically sound short-term trading system that provides traders with high-quality entry signals by combining EMA channels, momentum wave indicators, and multi-timeframe confirmation mechanisms. The strategy's greatest feature is its comprehensive risk management system, including dynamic stop-loss settings and risk-based position control, effectively safeguarding capital.
Despite potential risks such as market reversals and parameter optimization challenges, the strategy's robustness and adaptability can be further enhanced by introducing time filters, dynamic parameter adaptation, and multi-indicator comprehensive scoring systems. This strategy is particularly suitable for quantitative traders who pursue efficient short-term trading while emphasizing risk control.
With reasonable parameter settings and continuous monitoring and optimization, this strategy has the potential to become an important tool in a trader's arsenal, helping them capture trading opportunities in rapidly fluctuating markets and achieve stable profits.
- 1