
Strategy Overview
This strategy is a multi-indicator fusion volatility capture adaptive trend-following strategy, primarily designed for trading on a 1-hour timeframe for highly volatile instruments. The strategy combines moving averages, ATR volatility indicators, RSI relative strength index, MACD indicators, and volume filters to construct a multi-level trading decision system. The core idea is to capture significant volatility opportunities based on confirmed trend direction, while managing risk through dynamic profit-taking and stop-loss mechanisms.
The main features of the strategy include a time filter (only considering data from the last 30 days), multi-indicator comprehensive decision-making, dynamic stop-loss mechanisms, and volume confirmation. This design allows the strategy to adapt to changing market environments, focus on high-probability trading opportunities, and effectively filter out market noise.
Strategy Principles
The core principle of this strategy is to identify high-probability volatility opportunities through a multi-dimensional combination of technical indicators:
-
Time Filtering: The strategy first applies a 30-day time filter to ensure trading decisions are based on the latest market behavior, adapting to current volatility characteristics and trend patterns.
-
Trend Identification: Uses 5-period and 13-period Simple Moving Averages (SMA) as trend confirmation tools. An uptrend is confirmed when the fast moving average (5-period) is above the slow moving average (13-period).
-
Volatility Confirmation: Calculates a 10-period Average True Range (ATR) with a multiplier of 1.5, ensuring entry only under significant volatility conditions. The strategy requires the current candle's price range (high-low) to exceed the ATR threshold.
-
Momentum Assessment: Uses a 14-period RSI indicator for momentum assessment, requiring the RSI to be between 35 (oversold) and 65 (overbought), avoiding entry in extreme conditions.
-
Trend Confirmation: Employs MACD (12, 26, 9) as an additional trend confirmation tool, requiring the MACD line to be above the signal line and positive, ensuring entry points align with bullish momentum.
-
Volume Verification: Requires current volume to exceed 1.5 times the 20-period simple moving average of volume, ensuring price movements are supported by sufficient market participation.
-
Price Position: Requires the closing price to be above the fast moving average, confirming price support.
The entry conditions combine all of the above factors, ensuring trades are executed only when multiple conditions are simultaneously met.
Strategy Advantages
Analyzing the code and logic of this strategy, the following significant advantages can be summarized:
-
Multi-dimensional Filtering: By combining indicators from multiple dimensions including trend, volatility, momentum, and volume, the strategy effectively reduces false signals, particularly suitable for trading on a 1-hour timeframe, significantly improving signal quality.
-
Adaptability: The 30-day time filter allows the strategy to adjust according to the latest market behavior, without being overly influenced by historical data, maintaining the strategy's timeliness.
-
Volatility Capture Capability: The ATR indicator and price range conditions enable the strategy to effectively capture significant market volatility, increasing profit opportunities.
-
Dynamic Risk Management: The strategy adopts a combination of fixed percentage stop-loss and ATR-based stop-loss, and introduces ATR-based trailing stops. This multi-level risk management mechanism can protect capital while maximizing the capture of price increases.
-
Volume Confirmation: The volume filter requires price movements to be supported by sufficient market participation, reducing the risk of false breakouts in low liquidity environments.
-
Conservative Profit Targets: Setting conservative profit targets of 3-7% is suitable for short-term trading of volatile assets, helping to quickly lock in profits and avoid drawdowns.
-
Visualization and Alert Functions: The strategy provides clear chart visualization and alert functionality, making it convenient for traders to monitor and execute trades without constant chart watching.
Strategy Risks
Despite the sophisticated design, the following potential risks exist:
-
Over-optimization Risk: The strategy uses multiple parameters and indicators, risking overfitting to historical data, which may lead to poor future performance. The solution is to conduct rigorous backtesting validation under different market conditions and time periods.
-
Trading Frequency and Costs: On a 1-hour timeframe, the strategy may trigger many trading signals, increasing trading costs. It is recommended to consider fee factors in actual trading and possibly adjust entry conditions to reduce trading frequency.
-
Market Noise: Despite multiple filtering conditions, noise on 1-hour charts may still lead to some false signals. It is recommended to confirm with market trends on higher timeframes.
-
Sudden Event Risk: Sudden market news may cause prices to fluctuate sharply, breaking through stop-loss levels. It is recommended to use money management strategies, investing only a small percentage (1-2%) of total funds per trade.
-
Technical Indicator Lag: Indicators such as moving averages and MACD have certain lag, potentially missing optimal entry points in rapidly changing markets. Consider introducing leading indicators as supplements.
-
Reliance on Recent Data: The 30-day time filter may make the strategy overly dependent on recent market behavior, ignoring long-term patterns. Regularly evaluate and adjust strategy parameters to adapt to changing market environments.
-
One-sided Strategy Limitations: The current strategy is designed only for long positions, unable to capture opportunities in declining markets. Consider developing corresponding short strategies to address various market environments.
Strategy Optimization Directions
Based on an in-depth analysis of the strategy, here are potential optimization directions:
-
Adaptive Parameter Adjustment: Introduce adaptive mechanisms to automatically adjust ATR multipliers and moving average periods based on market volatility. For example, reduce the ATR multiplier in low volatility environments and increase it in high volatility environments, allowing the strategy to better adapt to different market states.
-
Add Market Sentiment Indicators: Consider introducing VIX index or similar market sentiment indicators, adjusting entry criteria during extreme market sentiment to avoid entering during market panic or excessive greed.
-
Time Filter Optimization: Try different time filtering methods, such as automatically adjusting lookback periods based on market cycles, or adding intraday time filters to avoid low liquidity periods.
-
Multi-timeframe Confirmation: Introduce trend confirmation from higher timeframes (such as 4-hour or daily), executing trades only when trends on higher timeframes are consistent, reducing counter-trend trading risks.
-
Dynamic Position Management: Dynamically adjust position sizes based on volatility and risk assessment, increasing positions when high-confidence signals appear and reducing positions during higher uncertainty.
-
Machine Learning Enhancement: Consider applying machine learning algorithms to optimize parameter selection and signal generation processes, training models on historical data to improve prediction accuracy.
-
Correlation Filtering: Introduce correlation analysis with related assets (such as major indices or related sectors), adjusting strategy behavior when correlations are abnormal to avoid trading during unusual market conditions.
-
Profit-taking Strategy Optimization: Implement a staged profit-taking strategy, such as taking profit on part of the position at 3%, with the remainder using a trailing stop, both securing profits and retaining room for larger increases.
These optimization directions aim to improve the strategy's adaptability, accuracy, and robustness, enabling it to maintain good performance across various market environments.
Summary
The Multi-Indicator Fusion Volatility Capture Adaptive Trend-Following Strategy is a sophisticated trading system that effectively identifies high-probability trading opportunities by integrating multiple technical indicators and filtering conditions. The core advantages lie in its multi-dimensional signal confirmation mechanism and dynamic risk management system, making it particularly suitable for trading volatile instruments on a 1-hour timeframe.
Through the combination of time filtering, trend identification, volatility confirmation, momentum assessment, trend confirmation, volume verification, and price position, the strategy can effectively filter out noise and improve signal quality. Meanwhile, the dynamic stop-loss mechanism and conservative profit target setting maximize market opportunity capture while ensuring capital safety.
Despite risks such as over-optimization, trading costs, and market noise, the strategy's robustness and adaptability can be further enhanced through adaptive parameter adjustment, multi-timeframe confirmation, and dynamic position management. In practical application, traders are advised to strictly control risk, investing only 1-2% of total capital per trade, and make trading decisions in conjunction with the overall market environment.
Overall, this is a comprehensive strategy suitable for medium to short-term trading, providing traders with a systematic, disciplined trading method that effectively manages risk while capturing volatility opportunities through a carefully designed multi-level decision mechanism.
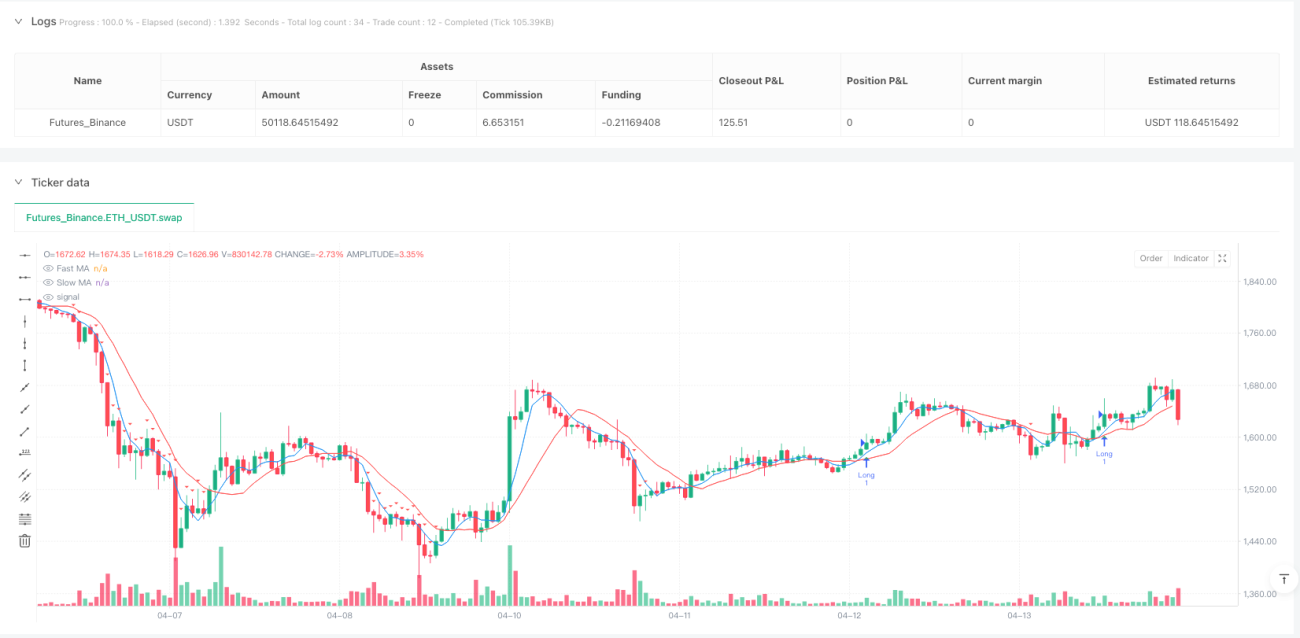
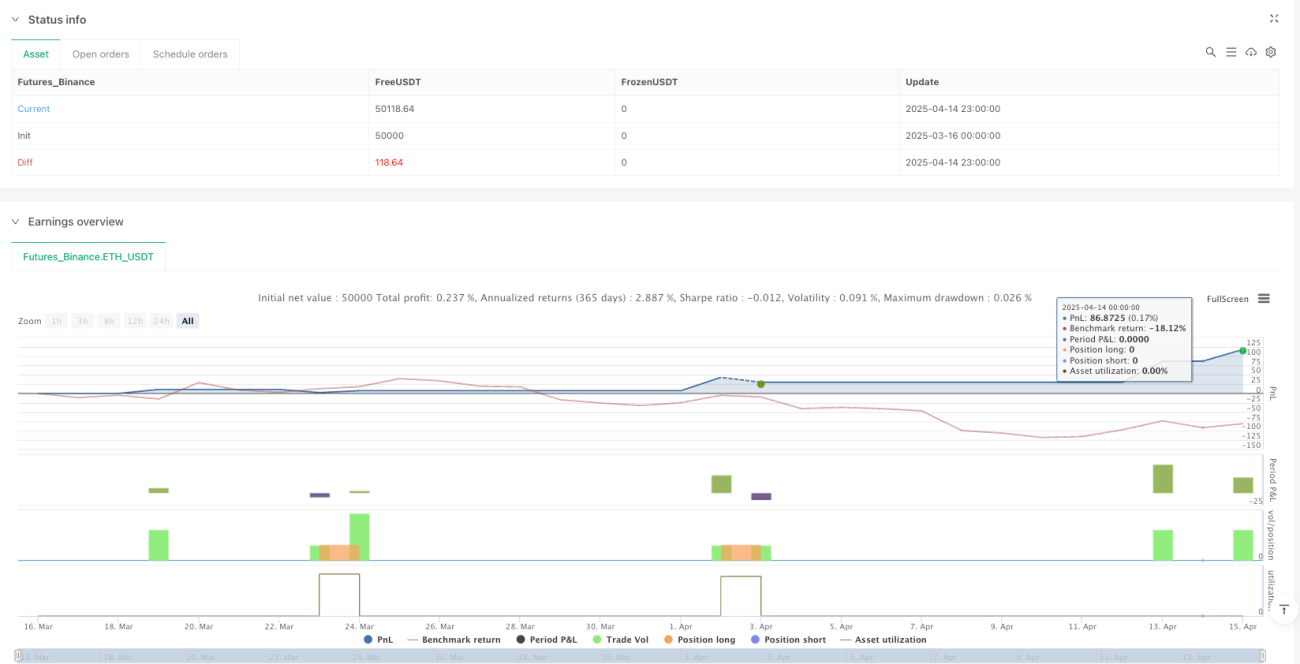
/*backtest
start: 2025-03-16 00:00:00
end: 2025-04-15 00:00:00
period: 1h
basePeriod: 1h
exchanges: [{"eid":"Futures_Binance","currency":"ETH_USDT"}]
*/

//@version=5
strategy("BONK 1H Enhanced Volatility Strategy", overlay=true, margin_long=100, margin_short=0, calc_on_order_fills=true)

// --- Inputs ---- 1