
Strategy Overview
The Trend Volume Breakout Trading Strategy is a quantitative trading approach that combines abnormal volume growth, price trend direction, and candlestick color. This strategy generates buy and sell signals by identifying unusual volume breakthroughs, combined with the direction of price trends and the color of the current candlestick. It uses an Exponential Moving Average (EMA) of volume to identify abnormal volume spikes that may indicate strong market activity, while incorporating a 50-period price EMA to filter trends and determine entry direction.
Strategy Principle
The core principle of this strategy is to search for directional volume breakouts. The strategy first calculates the Exponential Moving Average (EMA) of volume, with a default period of 20. When the current volume exceeds its EMA multiplied by a user-defined multiplier (default is 2.0), it's identified as a volume spike. This indicates a significant increase in market activity, potentially signaling a trend continuation or reversal.
The strategy simultaneously uses a 50-period price EMA to determine market trends. When price is above the EMA, it's considered an uptrend; when price is below the EMA, it's considered a downtrend. Additionally, the strategy also considers candlestick color as a confirmation signal: buy signals are only generated when the current candle is bullish (closing price higher than opening price), and sell signals are only generated when the candle is bearish (closing price lower than opening price).
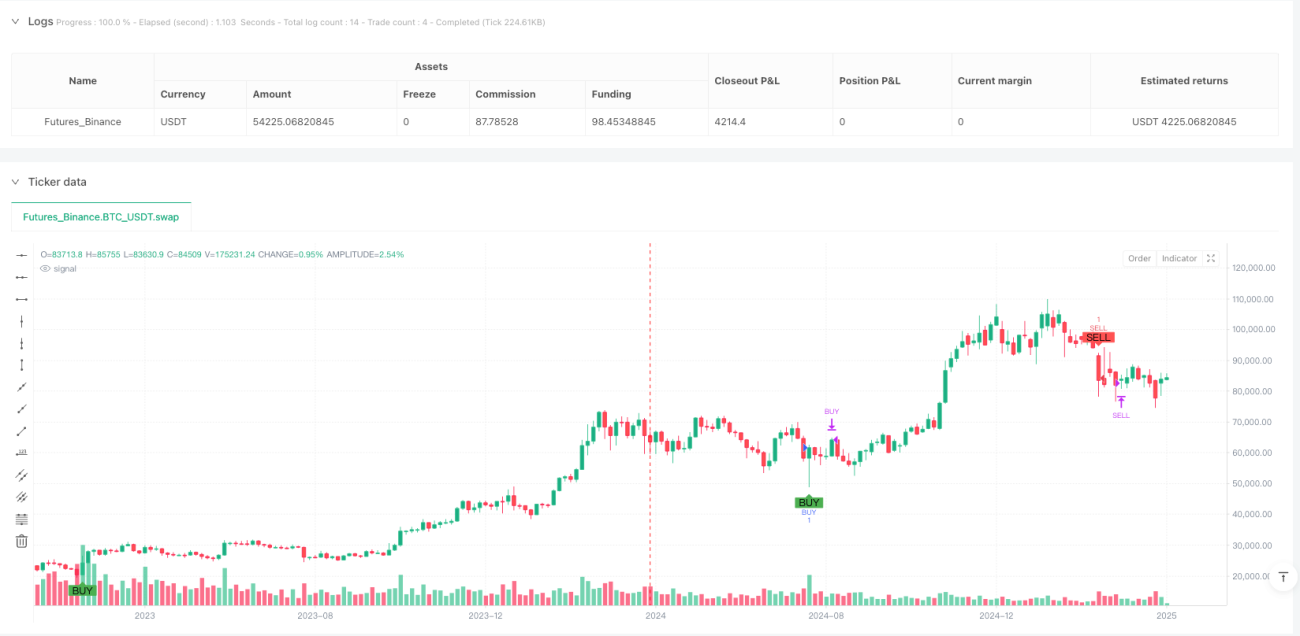
The conditions for generating a buy signal are: a volume spike occurs, price is in an uptrend, and the current candle is bullish. The conditions for generating a sell signal are: a volume spike occurs, price is in a downtrend, and the current candle is bearish. The strategy also sets an automatic exit condition, defaulting to closing positions after 5 periods following trade entry, but users can adjust this parameter based on their preferences, timeframe, and backtesting results.
Strategy Advantages
The Trend Volume Breakout Trading Strategy has several significant advantages:
-
Multiple Confirmation Mechanism: The strategy combines three key factors to generate signals - volume breakout, trend direction, and candle color. This multiple confirmation mechanism can reduce the possibility of false signals.
-
Flexible Parameter Adjustment: The strategy allows users to adjust the volume EMA period, volume multiplier, and exit time, enabling the strategy to adapt to different market environments and trading preferences.
-
Simple and Intuitive Logic: Although the strategy combines multiple factors, its logic is simple and straightforward, easy to understand and apply.
-
Automatic Exit Mechanism: The strategy has a built-in time-based exit mechanism, which helps control the holding time of each trade and reduces the possibility of holding losing positions.
-
Visual Aids: The strategy provides visualization markers for buy and sell signals, allowing traders to intuitively identify potential trading opportunities.
Strategy Risks
Despite its obvious advantages, the strategy also has some potential risks:
-
Parameter Sensitivity: The settings of the volume multiplier and EMA periods have a significant impact on strategy performance. Improper parameter settings may lead to too many false signals or missing important trading opportunities. The solution is to find optimal parameter combinations through backtesting under different market conditions.
-
Limitations of Fixed Exit Time: An exit strategy based on a fixed number of periods may not always be optimal. In strong trends, it might exit profitable trades too early; in rapid reversals, it might not cut losses in time. The solution is to combine other exit conditions, such as trailing stops or exit signals based on technical indicators.
-
Simplified Trend Definition: Using a single 50-period EMA to define trends may be oversimplified and fail to capture market complexity. In range-bound markets, this trend definition may produce misleading signals. The solution is to combine trend analysis across multiple timeframes or add additional trend confirmation indicators.
-
Sensitivity to Anomalous Data: Abnormally high volume (such as after major news events) may trigger signals, but these may not represent sustainable price movements. The solution is to use the strategy cautiously before and after major economic data releases or company announcements.
Strategy Optimization Directions
Based on code analysis, the strategy has several possible optimization directions:
-
Dynamic Volume Threshold: The strategy currently uses a fixed multiplier to determine volume spikes. Consider implementing a dynamic threshold, for example, adjusting the multiplier based on volume standard deviation or volatility, allowing the strategy to better adapt to different market fluctuation conditions.
-
Enhanced Trend Confirmation: Other trend indicators (such as MACD, ADX, or multi-period moving averages) could be introduced to enhance trend confirmation and reduce false signals in sideways markets.
-
Improved Exit Strategy: In addition to time-based exits, price-based stop-loss and take-profit mechanisms could be added, such as using ATR (Average True Range) to set dynamic stop-loss levels, or using key support and resistance levels as target prices.
-
Adding Trading Filters: Additional filtering conditions could be added, such as avoiding trading during major economic data releases, or pausing trading when market volatility is too low, to improve signal quality.
-
Optimizing Timeframe Settings: The strategy could be extended to multi-timeframe analysis, for example, confirming trend direction in a longer timeframe, then looking for entry opportunities in a shorter timeframe, to improve trading win rates.
Summary
The Trend Volume Breakout Trading Strategy is a comprehensive trading system that integrates volume analysis, trend following, and candlestick patterns. By looking for volume breakouts combined with price trends and candlestick colors, the strategy can identify potentially favorable trading opportunities. Its multiple confirmation mechanism helps reduce false signals, while adjustable parameters provide flexibility to adapt to different market environments.
Although the strategy logic is simple and intuitive, traders still need to be aware of the sensitivity of parameter settings and the limitations of fixed exit mechanisms. By implementing the suggested optimization measures, such as dynamic volume thresholds, enhanced trend confirmation, and improved exit strategies, the robustness and profitability of the strategy can be further enhanced.
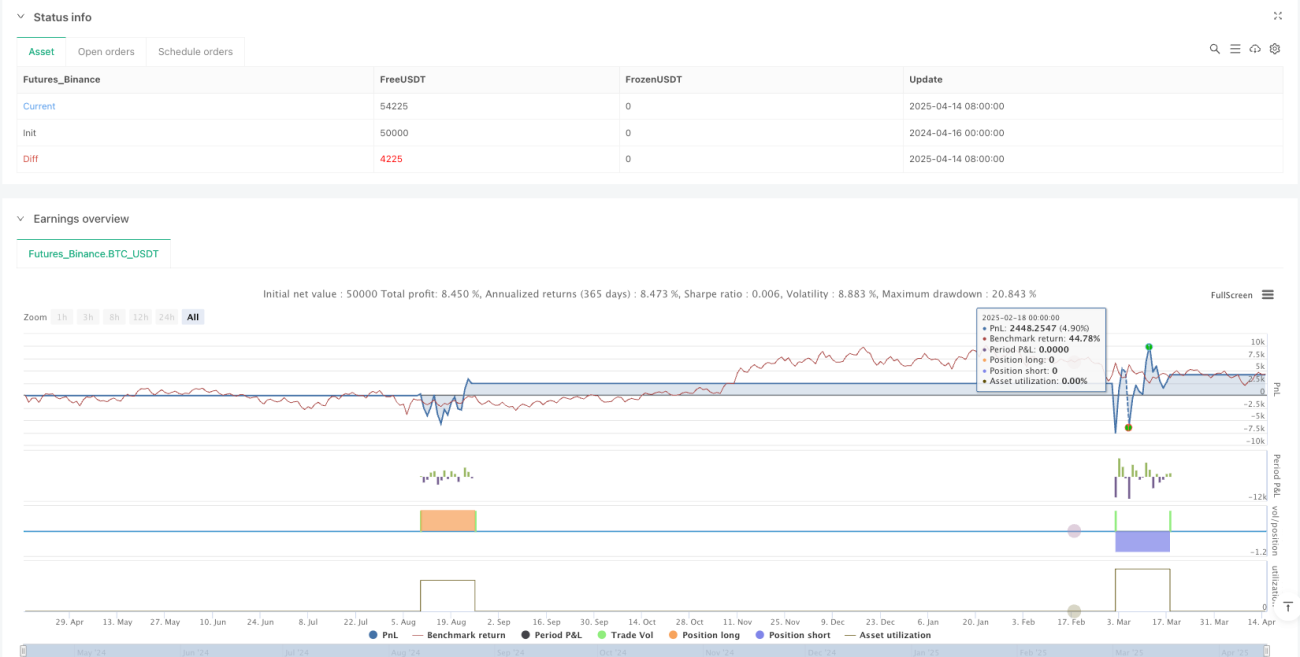
Most importantly, traders should test this strategy through backtesting in different market environments, find the parameter settings that best suit their trading style and risk preferences, and use the strategy in conjunction with sound money management principles.
- 1