
Overview
The Multi-Indicator Synergistic Short-Term Trend Following Strategy is a quantitative trading system that combines EMA, MACD, and RSI technical indicators with an ATR-based dynamic trailing take profit mechanism. This strategy confirms signals through multiple indicator collaboration, seeking momentum continuation opportunities in short-term trading while managing risk and securing profits through dynamic trailing take profit. The strategy's main feature is balancing signal frequency and accuracy, making it suitable for short-term trading in markets with noticeable volatility but with a definite trend direction.
Strategy Principles
The core principle of this trading strategy is to enhance signal reliability through multiple technical indicator confirmation. Specifically:
-
Trend Confirmation Layer: Uses EMA(20) as the primary trend determination tool. Price above EMA indicates an uptrend suitable for long positions; price below EMA indicates a downtrend suitable for short positions.
-
Momentum Confirmation Layer: Uses fast MACD(6,13,6) to capture short-term momentum changes. MACD line crossing above the signal line confirms buying momentum; MACD line crossing below the signal line confirms selling momentum.
-
Filter Layer: Uses RSI(9) as a market state filter. Buy signals require RSI to be in the 40-75 range, avoiding oversold and overbought areas; sell signals require RSI below 60, ensuring exit when momentum weakens.
-
Risk Management Layer: Combines fixed percentage take profit (1%) with ATR-based trailing stop loss. The ATR calculation period is 14, and the ATR multiplier is 0.8, providing an adaptive exit mechanism based on market volatility.
The trading logic execution flow is as follows:
- Long condition: Price > EMA(20) AND MACD line crosses above signal line AND RSI between 40-75
- Short condition: Price < EMA(20) AND MACD line crosses below signal line AND RSI < 60
- Take profit/stop loss settings: Fixed take profit at ±1% of entry price, while enabling 0.8x ATR trailing stop loss
Strategy Advantages
Through in-depth analysis of the strategy code, the following advantages can be summarized:
-
Multi-dimensional Confirmation Mechanism: Effectively reduces false signal risk through confirmation from three different dimensional indicators - EMA, MACD, and RSI. EMA provides trend direction, MACD captures momentum changes, and RSI filters extreme market conditions.
-
Adaptive Risk Management: Combining fixed take profit with ATR-based trailing stop loss automatically expands protection range when volatility increases and tightens protection range when volatility decreases, adapting to different market environments.
-
Parameter Optimization Balance: The code selects relatively short-cycle parameters (MACD 6-13-6, RSI 9), helping to capture market changes faster and improving the timeliness of short-term trading.
-
Bi-directional Trading Strategy: Includes both long and short logic, allowing for trading opportunities in different market environments, increasing the strategy's adaptability and comprehensiveness.
-
Integrated Capital Management: Uses 100% of account equity for trading by default, simplifying the capital management process and facilitating backtesting and live trading.
Strategy Risks
Despite the relatively comprehensive design of this strategy, there are still some potential risks:
-
False Breakout Risk: Short-period MACD is susceptible to market noise producing false breakout signals, especially in sideways consolidating markets. Solutions could include adding additional volume confirmation or optimizing MACD parameters.
-
RSI Range Too Wide: The current RSI filter range (40-75 for long, <60 for short) is relatively loose and may not adequately filter out poor signals in extreme market conditions. Consider dynamically adjusting the RSI range based on different market characteristics.
-
Fixed Take Profit Percentage Risk: A 1% fixed take profit may be too small in high-volatility markets, causing frequent premature exits; in low-volatility markets, it may be too large and difficult to trigger. Consider linking the take profit percentage to ATR for adaptive take profit.
-
Parameter Sensitivity: The current strategy effectiveness heavily depends on the parameter settings of EMA, MACD, RSI, etc. Different market environments may require different parameters, posing an overfitting risk. It is recommended to perform sensitivity tests with different parameter combinations.
-
Lack of Market Environment Recognition: The strategy does not have a built-in mechanism for identifying market environments (oscillating/trending), which may lead to frequent trading in unsuitable market environments, increasing costs and reducing win rates.
Strategy Optimization Directions
Based on the analysis of this strategy, the following optimization directions can be proposed:
-
Add Market Environment Filter: Add ADX or volatility indicators to identify market environments, using more aggressive parameters when trends are obvious and more conservative parameters or pausing trading in oscillating markets. This optimization can improve the strategy's environmental adaptability.
-
Dynamic Parameter Adjustment Mechanism: Introduce adaptive parameter adjustment algorithms to automatically adjust EMA length, MACD parameters, and RSI thresholds based on recent N-period market performance, allowing the strategy to better adapt to market changes.
-
Integrate Volume Analysis: Add volume conditions to signal confirmation, such as requiring increased volume during MACD golden crosses, which can effectively filter out low-quality signals and improve strategy reliability.
-
Optimize Take Profit/Stop Loss Logic: Change fixed take profit to ATR-based dynamic take profit, setting the take profit target at X times ATR to match market volatility. Time-based stop loss can also be introduced to avoid long-term trapping.
-
Add Drawdown Control Mechanism: Add maximum drawdown control logic that automatically reduces positions or pauses trading when strategy drawdown reaches preset thresholds, waiting for market conditions to improve before resuming normal trading.
-
Introduce Machine Learning Optimization: Consider using machine learning algorithms to analyze historical data, predict the reliability of various indicator signals, assign weights to different signal combinations, and achieve intelligent assessment of signal quality.
Summary
The Multi-Indicator Synergistic Short-Term Trend Following Strategy is a clearly structured and logically sound quantitative trading system that captures short-term trend opportunities through the synergistic action of EMA, MACD, and RSI indicators, combined with ATR dynamic stop loss. It balances signal frequency and reliability, with a certain risk management capability.
The core value of this strategy lies in the combination of multi-dimensional signal confirmation and adaptive risk management, suitable for application in market environments with obvious trends but significant volatility. However, there is still room for optimization, especially in market environment recognition, dynamic parameter adjustment, and take profit/stop loss mechanisms.
By incorporating improvements in market environment filtering, dynamic parameter adjustment, volume confirmation, and optimized capital management, this strategy has the potential to further enhance its stability and profitability, becoming a more comprehensive and robust quantitative trading system. Both short-term traders and systematic investors can gain inspiration from this strategy design, customizing and optimizing it according to their own needs.
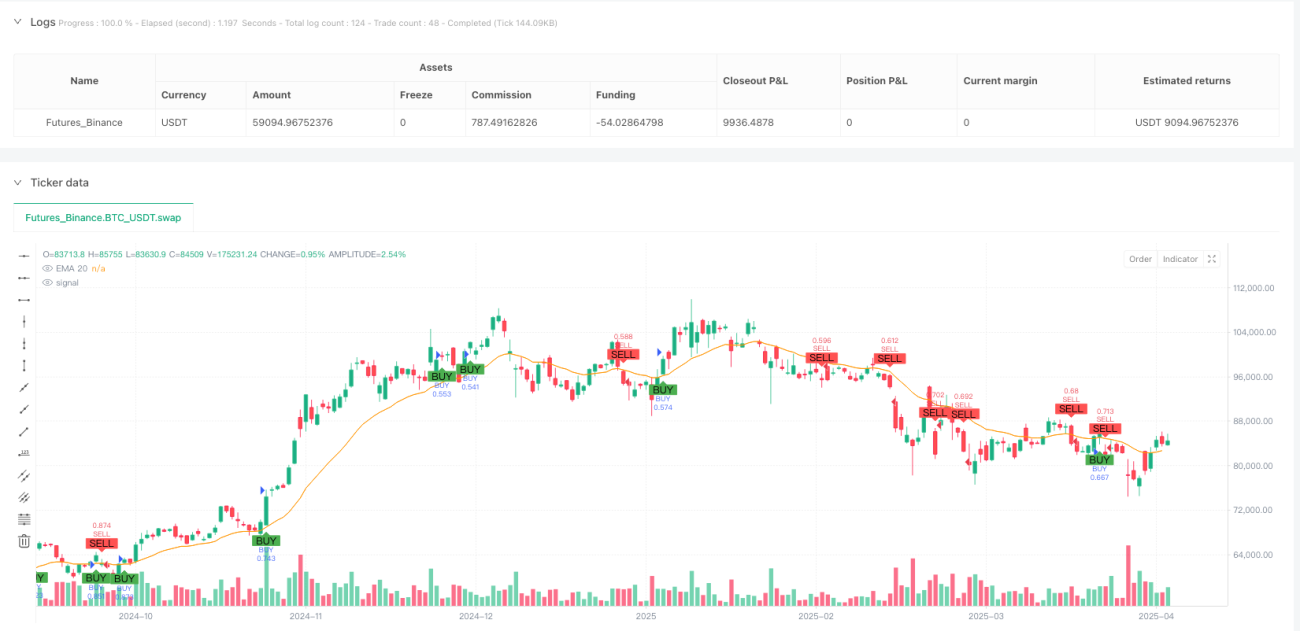
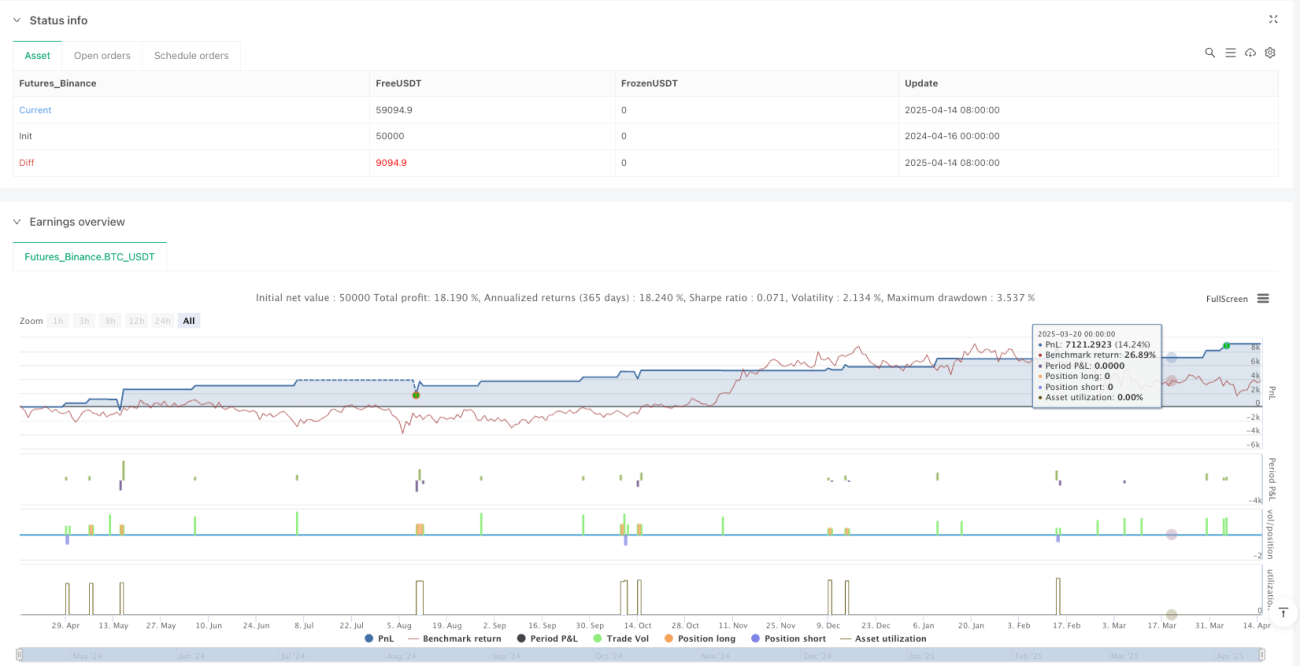
/*backtest
start: 2024-04-16 00:00:00
end: 2025-04-15 00:00:00
period: 1d
basePeriod: 1d
exchanges: [{"eid":"Futures_Binance","currency":"BTC_USDT"}]
*/

//@version=5
strategy("Scalping Pro Balance (EMA + MACD + RSI + Trailing TP)", overlay=true, default_qty_type=strategy.percent_of_equity, default_qty_value=100)

// === THAM SỐ ===- 1