
Overview
This strategy is a trend following trading system that combines the 200-period Moving Average (MA200) with momentum candle pattern analysis. It identifies trading opportunities by examining the price position relative to the long-term trend and momentum changes on the candlestick chart. The strategy is suitable for 4-hour and higher timeframes and features a built-in mechanism to prevent duplicate entries, ensuring no additional positions are opened when there is already an open position, effectively controlling position risk. Additionally, the strategy offers optional stop-loss and take-profit functions to help traders better manage the risk-reward ratio of each trade.
Strategy Principles
The core principles of this strategy are based on two key factors: determining price position relative to the long-term trend and analyzing candle body momentum.
First, the strategy uses a 200-period Simple Moving Average (SMA) as a reference indicator for the long-term trend. When the price is above MA200, it is considered to be in an uptrend; when the price is below MA200, it is considered to be in a downtrend.
Second, the strategy introduces the concept of momentum candles by comparing the current candle's body size with the previous candle. When the current candle body is larger than the previous candle body, it is considered to have stronger momentum.
The specific entry signal generation logic is as follows:
- Buy Signal: When the closing price is above MA200 (uptrend), and the current candle is a bullish momentum candle (closing price higher than opening price, and current candle body larger than previous candle body)
- Sell Signal: When the closing price is below MA200 (downtrend), and the current candle is a bearish momentum candle (closing price lower than opening price, and current candle body larger than previous candle body)
The strategy also includes an important risk control mechanism: new entry signals are only executed when there are no open positions, effectively avoiding excessive risk exposure caused by duplicate entries.
Stop-loss and take-profit settings can be customized through parameters, defaulting to 50 pips and 100 pips respectively, helping traders limit losses when the market moves against them and lock in profits when the price moves in the expected direction.
Strategy Advantages
Through in-depth analysis of the strategy's code implementation, the following clear advantages can be summarized:
-
Trend Confirmation and Momentum Combination: The strategy combines a long-term trend indicator (MA200) with a short-term momentum indicator (candle body comparison), effectively filtering out low-quality signals and only entering when the trend direction is clear and there is sufficient momentum.
-
Duplicate Entry Prevention Mechanism: By checking whether there are currently open positions (strategy.opentrades == 0), the strategy avoids adding to positions when trades are already open, effectively controlling capital risk.
-
Flexible Risk Management: Users can set stop-loss and take-profit levels according to their risk preferences, or completely turn off the SL/TP function, adapting to different trading styles.
-
Visual Signal Indicators: The strategy provides visualized buy and sell signal markers, allowing traders to intuitively identify entry points, improving the strategy's usability.
-
Adjustable Parameters: Key parameters such as MA period, stop-loss, and take-profit levels can be customized by users, enhancing the strategy's adaptability.
-
Focus on High-Quality Signals: By requiring the current candle body to be larger than the previous candle body, the strategy focuses on capturing market movements with accelerating momentum, improving signal quality.
Strategy Risks
Despite the reasonable design of this strategy, the following potential risks still exist:
-
Moving Average Lag: The 200-period moving average as a long-term trend indicator has obvious lag, which may generate incorrect signals consistent with the old trend during the initial phase of trend reversals. The solution is to consider introducing short-term moving averages as auxiliary confirmation indicators.
-
Fixed Stop-Loss Risk: The strategy uses a fixed number of pips as stop-loss settings without considering changes in market volatility, which may lead to premature stop-outs during highly volatile periods. An improvement would be to consider using dynamic indicators such as ATR (Average True Range) to adjust stop-loss levels.
-
Single Entry Condition: Although the strategy combines trend and momentum, the entry conditions are relatively simple and may generate too many false signals in certain market environments. It is recommended to add additional filtering conditions, such as volume confirmation or auxiliary signals from other technical indicators.
-
Lack of Market Environment Recognition: The strategy does not distinguish between different market environments (such as ranging vs. trending markets) and may perform poorly in consolidating markets. Consider adding market environment judgment logic to adjust strategy parameters or pause trading in different environments.
-
Imperfect Capital Management: Although the strategy sets a fixed position ratio (10% of equity), it does not adjust position size based on different trade win rates or risks. It is recommended to implement more complex money management algorithms, such as the Kelly formula or fixed risk models.
Strategy Optimization Directions
Based on the above analysis, the strategy can be optimized in the following directions:
-
Introduce Multi-Timeframe Analysis: The current strategy only runs on a single timeframe. Consider adding a multi-timeframe confirmation mechanism, such as only opening positions when daily and 4-hour trends are consistent, to improve signal quality.
-
Dynamic Stop-Loss Mechanism: Change fixed pip stop-losses to ATR-based dynamic stop-losses to better adapt to market volatility changes. For example, set stop-loss at 2x ATR, narrowing the stop-loss range during low volatility periods and widening it during high volatility periods.
-
Add Signal Filters: Introduce additional technical indicators as confirmation, such as RSI overbought/oversold conditions, MACD histogram direction, volume confirmation, etc., to reduce the probability of false signals.
-
Add Trailing Stop Function: Implement a trailing stop feature that automatically adjusts the stop-loss position as the price moves favorably, locking in partial profits while giving the price sufficient room to breathe.
-
Optimize Capital Management: Implement risk-based capital management for each trade, such as a fixed risk model (each trade risking a fixed 1% of account funds), or dynamically adjusting position size based on signal strength.
-
Add Market State Assessment: Develop a market environment recognition module that may pause trading or adjust to more conservative parameter settings in ranging markets.
-
Enhance Momentum Judgment Logic: The current momentum judgment is based on a simple comparison of candle body sizes. Consider introducing more complex momentum models, such as considering the body change trend of N consecutive candles.
Conclusion
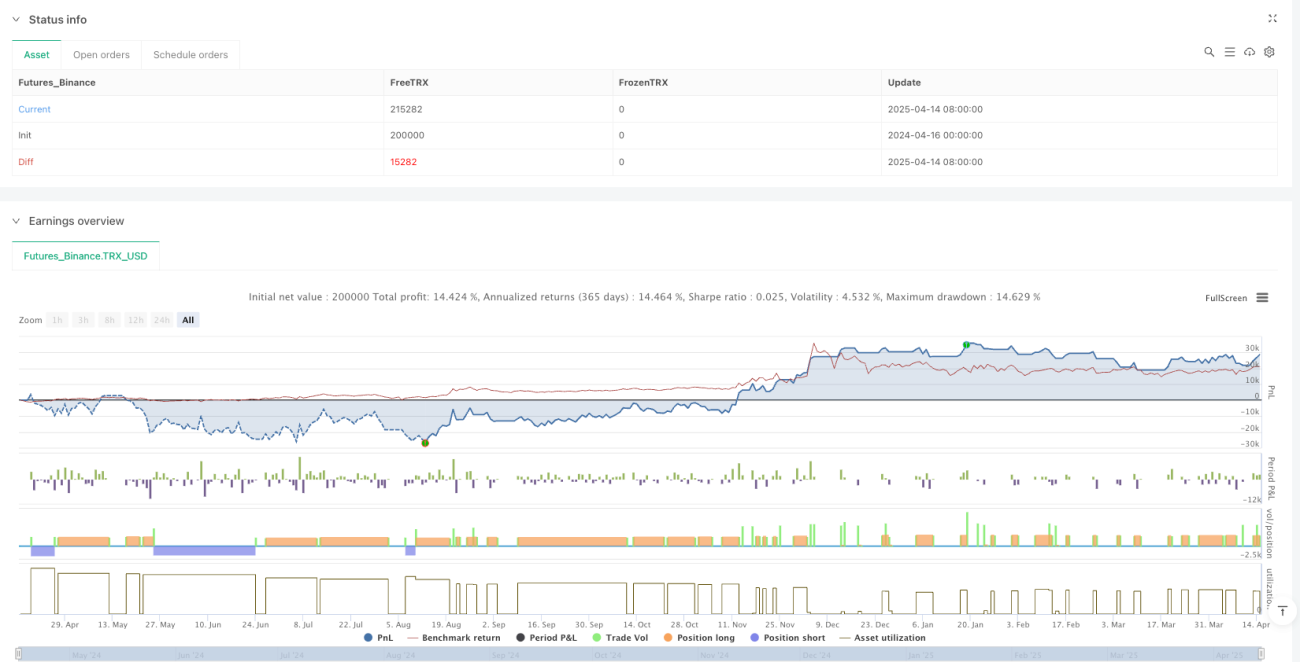
The Moving Average and Momentum Candle Trend Following System is a trading strategy that combines long-term trend determination with short-term momentum analysis. It determines the overall market trend direction using a 200-period moving average while capturing momentum-driven market movements through changes in candle body size. The strategy features a built-in mechanism to prevent duplicate entries and optional stop-loss/take-profit functions, demonstrating good risk management awareness.
The main advantage of this strategy lies in its concise yet effective signal generation logic and the dual confirmation requirement of trend and momentum, which helps filter out low-quality signals. However, the strategy also has limitations, such as the lag of moving averages and the potential risks of fixed stop-losses.
By introducing multi-timeframe analysis, dynamic stop-losses, enhanced signal filtering, and optimized capital management, this strategy can be further improved to enhance its performance stability and profitability across different market environments. For investors pursuing trend-following trading, this is a worthwhile basic strategy framework that can be customized and extended according to individual needs.
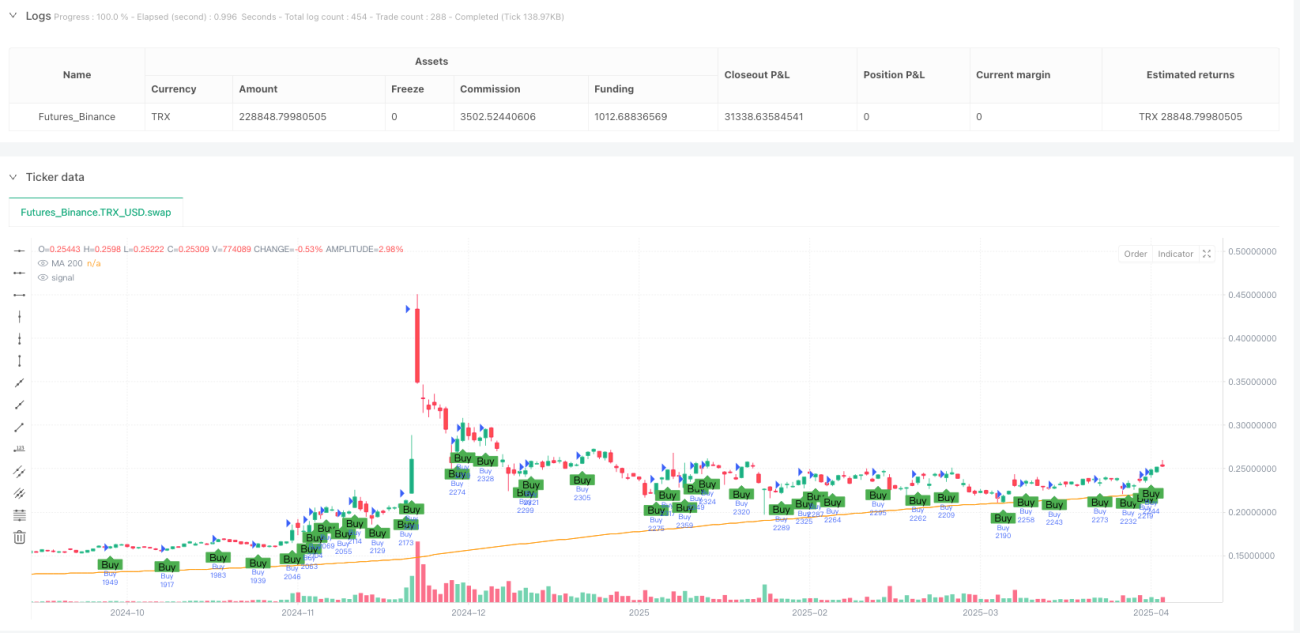
/*backtest
start: 2024-04-16 00:00:00
end: 2025-04-15 00:00:00
period: 1d
basePeriod: 1d
exchanges: [{"eid":"Futures_Binance","currency":"TRX_USD"}]
*/

//@version=5
strategy("MA200 + Momentum Candle Strategy (No Duplicate Entry)", overlay=true, default_qty_type=strategy.percent_of_equity, default_qty_value=10)

// === Input- 1