
Overview
The Multiple EMA Trend Confirmation with RSI Entry Filter Strategy is a quantitative trading system designed specifically to identify bullish trends. This strategy cleverly combines four Exponential Moving Averages (EMAs) of different periods with the Relative Strength Index (RSI) to confirm trend direction and optimize entry timing. By ensuring proper EMA alignment and maintaining reasonable RSI value control, the strategy aims to capture strong upward trends while avoiding entries in overbought areas, thereby improving trading success rates and capital efficiency.
Strategy Principles
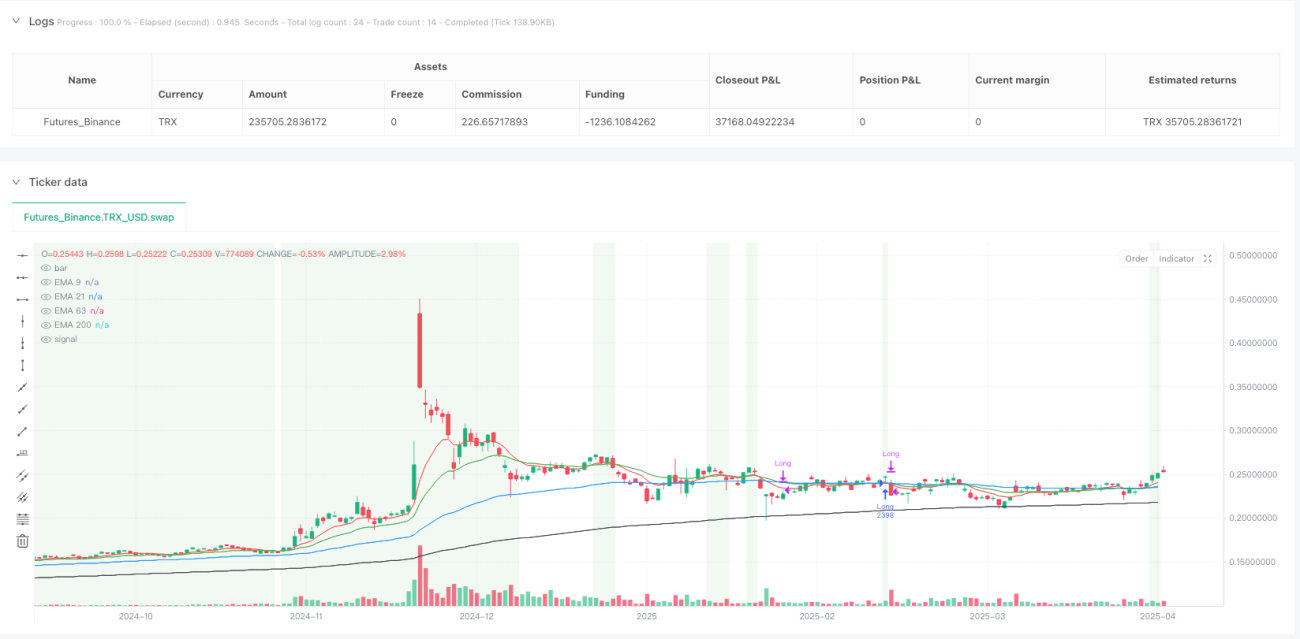
The core principle of this strategy is based on multi-timeframe analysis, using short-term, medium-term, and long-term moving averages to confirm trend strength and direction. Specifically, the strategy uses four EMAs: 9-day (ultra-short term), 21-day (short term), 63-day (medium term), and 200-day (long term).
The entry logic is clear and strict:
- Trend confirmation condition: Requires EMAs to form a stair-step arrangement, i.e., 9-day EMA > 21-day EMA > 63-day EMA > 200-day EMA, indicating that all timeframes from short to long-term are in an uptrend
- Price confirmation: Closing price must be above the 9-day EMA, ensuring the current price is above the shortest-term average
- RSI filter condition: 14-period RSI must be ≤ 60, a condition designed to avoid entering in already overbought situations
The exit logic is primarily based on trend reversal signals:
- When the 21-day EMA crosses below the 63-day EMA, indicating that the short-term trend begins to weaken relative to the medium-term trend, the strategy will close positions
The strategy also considers two commented-out exit conditions:
- RSI > 80 (overbought)
- Closing price > 1.4 × 126-day EMA (price far above average level)
Through the combination of these conditions, the strategy forms a complete trend following system with emphasis on trend confirmation and risk control.
Strategy Advantages
-
Multi-level Trend Confirmation: Using four EMAs of different periods provides more reliable trend confirmation and reduces false signals. The stair-step arrangement requirement ensures entry only when uptrends are confirmed across all timeframes, significantly improving signal quality.
-
Entry Timing Optimization: Incorporating the RSI ≤ 60 condition avoids entries in overbought areas, which helps prevent chasing high prices and potential retracement risks.
-
Clear Trend Visualization: The strategy marks each EMA line with different colors on the chart and uses background color changes (light green for bullish markets, light red for bearish markets) to intuitively display market conditions, allowing traders to easily identify the current trend environment.
-
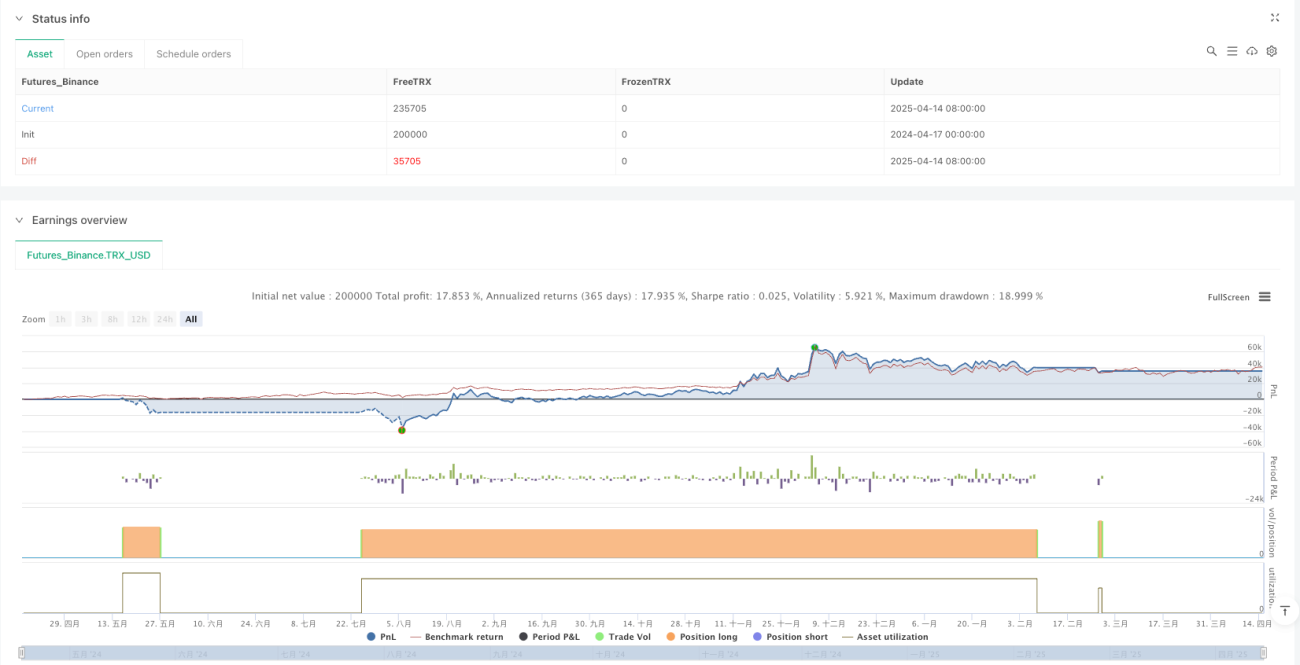
Integrated Money Management: The strategy incorporates money management rules, using only 10% of capital for each trade, which helps control risk and extend account longevity.
-
High Adaptability: The code structure is clear, easy to extend and modify. For example, the commented-out 126-day EMA and additional exit conditions can be easily activated as needed, allowing the strategy to adapt to different market environments.
-
Cost Awareness: The strategy accounts for a 0.75% round-trip trading commission, making backtesting results closer to actual trading environments.
Strategy Risks
-
Lagging Trend Identification: Since EMAs are inherently lagging indicators, the strategy may identify and enter trends only after they have already developed for some time, missing part of the initial movement. To address this risk, consider adjusting EMA periods or adding more sensitive trigger conditions.
-
Premature Exit Risk: Exiting when the 21-day EMA crosses below the 63-day EMA may lead to prematurely exiting long-term trends during short-term fluctuations. Solutions may include adding confirmation conditions or using trailing stops instead of fixed exit signals.
-
Overly Strict Filtering: The RSI ≤ 60 requirement may cause missed opportunities in strong uptrends, especially in rapidly rising markets. Consider dynamically adjusting the RSI threshold based on different market states.
-
Single Direction Trading Limitation: The strategy only focuses on long opportunities, ignoring potential short opportunities, which may lead to prolonged inactivity in bear markets or ranging markets. Extending the strategy to include short rules can address this limitation.
-
Fixed Parameter Risk: All indicator parameters (EMA periods, RSI period) are fixed and may not be suitable for all market conditions. Implementing parameter optimization or adaptive parameters can improve strategy performance across different market environments.
-
Uniform Capital Allocation: Using a fixed 10% of capital may not be optimal. Dynamically adjusting position size based on market volatility and signal strength can better control risk and optimize returns.
Strategy Optimization Directions
-
Enhance Entry Signal Quality: Consider integrating additional confirmation indicators, such as volume confirmation or momentum indicators (MACD, Stochastic, etc.). This is because relying solely on price and EMAs may generate false signals in ranging markets, while multi-indicator confirmation can increase signal reliability.
-
Optimize Exit Mechanisms: The existing exit mechanism is relatively simple; consider implementing the following improvements:
- Activate the commented-out RSI overbought (>80) exit condition
- Add trailing stops
- Incorporate partial profit-locking mechanisms
These improvements can help better protect realized profits while maintaining trend participation.
-
Dynamic Parameter Adjustment: Consider dynamically adjusting EMA periods and RSI thresholds based on market volatility. Use longer EMA periods and higher RSI thresholds in high-volatility environments, and the opposite in low-volatility environments. This allows the strategy to better adapt to different market conditions.
-
Add Short Logic: By mirroring the current long logic, add short conditions (reverse EMA arrangement + high RSI), allowing the strategy to profit in bear markets as well, improving capital utilization.
-
Refine Money Management: Dynamically adjust position size based on signal strength, market volatility, and current performance, instead of a fixed 10%. For example, increase position percentage when multi-timeframe consistency is stronger and RSI is in an ideal range.
-
Add Drawdown Control Mechanisms: Set maximum acceptable drawdown limits, reducing position size or pausing trading when specific drawdown levels are reached. This can prevent consecutive losses in unfavorable market conditions.
Summary
The Multiple EMA Trend Confirmation with RSI Entry Filter Strategy is a well-designed, logically clear trend following system. By combining multi-period EMA arrangement to confirm trend direction and using RSI to filter overbought areas, this strategy effectively controls risk exposure while maintaining high entry quality.
The strategy's strengths lie in its multi-level trend confirmation mechanism and entry timing optimization, while the main risks come from indicator lag and potential adaptability issues due to fixed parameters. By implementing the suggested optimization directions, especially enhancing exit mechanisms, dynamic parameter adjustment, and refined money management, the strategy has the potential to achieve more stable performance across different market environments.
For traders pursuing steady growth and preferring trend-following strategies, this is a worthwhile basic strategy framework that can be further customized and optimized according to individual risk preferences and market views.
/*backtest
start: 2024-04-17 00:00:00
end: 2025-04-15 08:00:00
period: 1d
basePeriod: 1d
exchanges: [{"eid":"Futures_Binance","currency":"TRX_USD"}]
*/

//@version=5
strategy("4 EMAs with Entry and Exit Strategy", overlay=true, initial_capital=1000000, default_qty_value=10, default_qty_type=strategy.percent_of_equity,commission_type=strategy.commission.percent, commission_value=0.75)

// Calculate EMAs- 1