Dynamic EMA Crossover RSI Neutral Zone Strategy with ATR Risk Management

Strategy Overview
The Dynamic EMA Crossover RSI Neutral Zone Strategy with ATR Risk Management is a quantitative trading approach that combines technical indicators with risk management principles. This strategy primarily utilizes the crossover signals between fast and slow Exponential Moving Averages (EMA), filtered by the Relative Strength Index (RSI) neutral zone, while employing Average True Range (ATR) for dynamic stop-loss and take-profit adjustments. This combination allows the strategy to capture key market trend reversals while avoiding entry during extreme overbought or oversold conditions, simultaneously adapting risk parameters based on market volatility.
Strategy Principles
The core principles of this strategy are based on the synchronized operation of several key components:
-
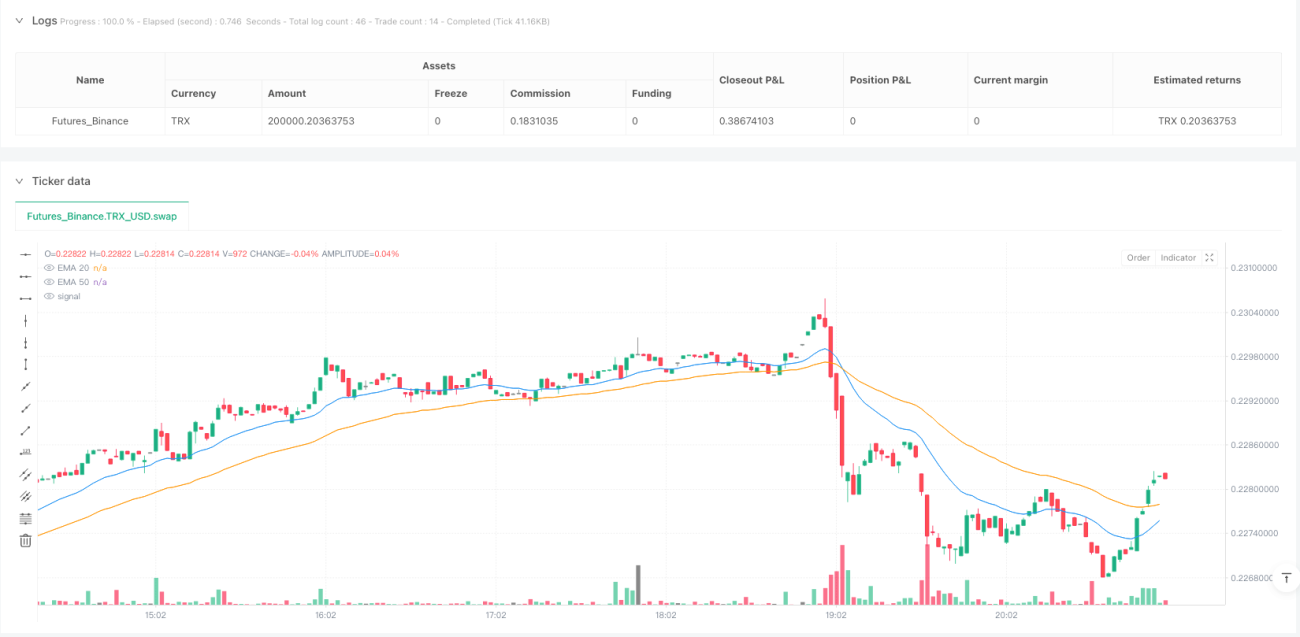
EMA Crossover Signals: The crossover between the fast EMA (default 20 periods) and slow EMA (default 50 periods) serves as the primary trend direction indicator. A buy signal is generated when the fast EMA crosses above the slow EMA; a sell signal is generated when the fast EMA crosses below the slow EMA. This crossover is typically viewed as an important technical indicator for trend reversal or confirmation.
-
RSI Neutral Zone Filtering: The strategy incorporates the RSI indicator (default 14 periods) as a secondary filter condition, executing trades only when RSI is within a neutral zone. Specifically:
- Buy conditions require RSI to be greater than 40 and less than 70, avoiding entry near overbought territory
- Sell conditions require RSI to be less than 60 and greater than 30, avoiding entry near oversold territory
This design effectively prevents trading in extreme RSI zones, reducing the risk of counter-trend trading.
-
ATR Dynamic Risk Management: The strategy uses ATR (14 periods) as a volatility indicator and dynamically calculates stop-loss and take-profit levels through a risk multiplier (default 1):
- Stop-loss distance = ATR × Risk Multiplier
- Take-profit distance = ATR × Risk Multiplier
For buy orders, the stop-loss is set below the current candle's low, and take-profit above the candle's high; for sell orders, it's the opposite.
-
Execution Logic: When buy conditions are met, the system executes a long entry with corresponding stop-loss and take-profit; when sell conditions are met, the system executes a short entry with similar risk parameters. The strategy visually marks "BUY" and "SELL" signals on the chart for intuitive understanding of trading opportunities.
Strategy Advantages
Through in-depth analysis of the strategy code, we can summarize the following significant advantages:
-
Multi-Indicator Confirmation: Combining EMA crossover and RSI indicators provides double confirmation, reducing the risk of false signals. EMA crossovers capture trend changes, while RSI ensures entry in relatively safe price zones, avoiding chasing highs or lows.
-
Adaptive Risk Management: Using ATR to dynamically adjust stop-loss and take-profit distances enables the strategy to adapt to different market environments and volatility conditions. It automatically widens stop-loss ranges in highly volatile markets and narrows them in low-volatility markets, maintaining consistent risk proportionality.
-
Predefined Exit Mechanisms: The strategy includes clear stop-loss and take-profit settings, ensuring that each trade has predefined exit points, effectively controlling single-trade risk and avoiding "hope trades" and emotional decision-making.
-
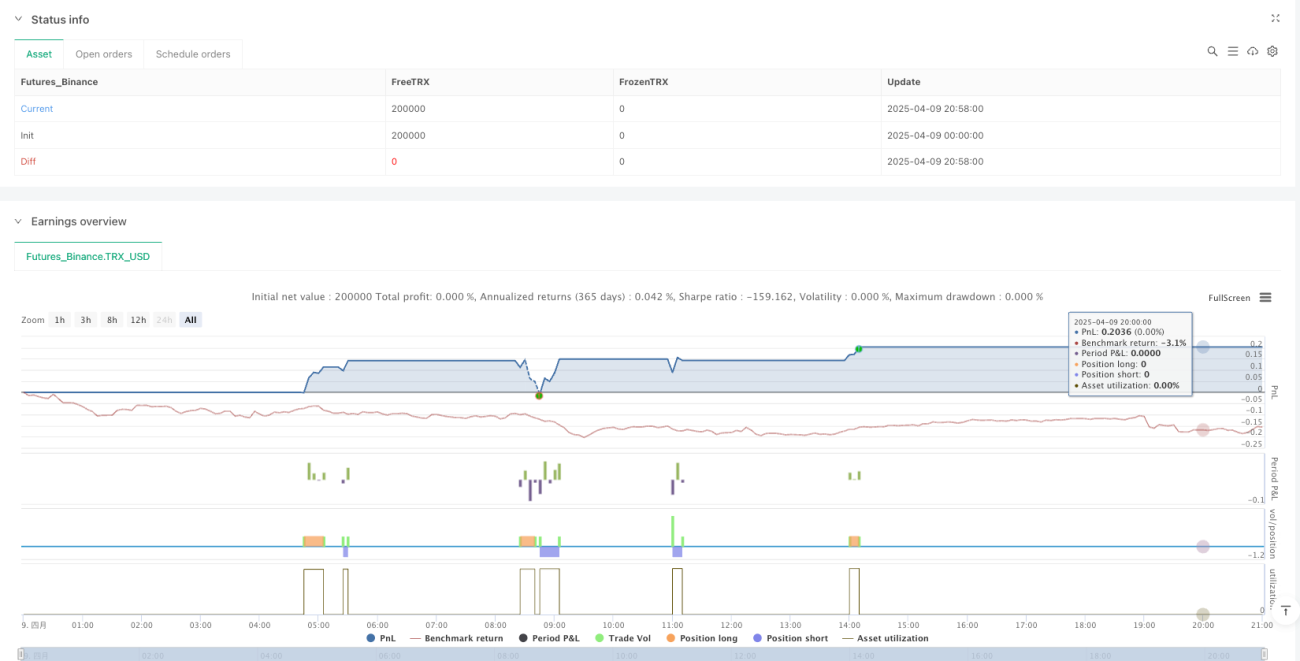
Visualized Trading Signals: The strategy clearly marks buy and sell signals on the chart, facilitating backtesting analysis and real-time monitoring, enhancing strategy transparency and comprehensibility.
-
Parametric Adjustability: The strategy provides multiple adjustable parameters, including EMA periods, RSI thresholds, and risk multipliers, allowing traders to optimize and customize according to different market conditions and personal risk preferences.
Strategy Risks
Despite its well-designed structure, the strategy still faces the following potential risks and challenges:
-
Poor Performance in Ranging Markets: In ranging markets without clear trends, EMA crossovers may generate frequent false signals, leading to consecutive losing trades. The solution is to introduce additional range-market filters, such as volatility indicators or ADX trend strength indicators.
-
Rapid Market Reversal Risk: In sharp market reversals, the strategy's stop-loss may not be timely enough, resulting in larger losses. Implementing trailing stops or introducing more sensitive market reversal indicators can mitigate this risk.
-
Parameter Optimization Overfitting: Excessive optimization of EMA periods, RSI thresholds, and risk multipliers may lead to good performance on historical data but poor results in live trading. Step-testing and out-of-sample validation are recommended to reduce overfitting risk.
-
Lack of Volume Filtering: The current strategy does not consider volume factors, potentially generating non-executable signals in low-liquidity environments. Adding volume confirmation conditions is recommended to ensure signal quality.
-
Fixed Multiplier Limitations: Although ATR provides volatility adaptability, a fixed risk multiplier may not be suitable for all market environments. Consider implementing a dynamically adjusting risk multiplier that automatically adapts based on market conditions and historical volatility characteristics.
Strategy Optimization Directions
Based on code analysis, the strategy has several potential optimization directions:
-
Add Trend Strength Filtering: Introduce ADX (Average Directional Index) as a trend strength filter, executing trades only when ADX is above a certain threshold (such as 25), avoiding false signals in weak trend or ranging markets.
-
Dynamic RSI Thresholds: The current RSI uses fixed neutral zone judgments. Consider dynamically adjusting RSI thresholds based on market volatility conditions, widening the neutral zone range in volatile markets and narrowing it in stable markets.
-
Implement Trailing Stops: Replace fixed stops with trailing stops, especially in strong trend markets, to lock in more profits and reduce drawdowns. This can be implemented by monitoring price movements and dynamically adjusting stop positions.
-
Optimize Risk-Reward Ratio: The current strategy has equal stop-loss and take-profit distances (both ATR × multiplier). Consider setting asymmetric risk-reward ratios, such as setting take-profit at 2x or 3x the stop-loss distance, improving expected returns.
-
Time Filters: Add time-frame based filtering conditions, such as executing trades only during specific trading sessions, or adjusting parameters based on high-volatility market periods, avoiding inefficient trading times.
-
Add Volatility Breakout Confirmation: After EMA crossover signals appear, add price volatility confirmation conditions, such as requiring prices to break through previous highs/lows within N periods after the signal appears, improving signal quality.
-
Money Management Optimization: The current strategy uses fixed position sizes. Implement volatility-based position management, increasing positions in low-volatility environments and decreasing them in high-volatility environments, maintaining consistent risk exposure.
Summary
The Dynamic EMA Crossover RSI Neutral Zone Strategy with ATR Risk Management is a comprehensive quantitative trading system combining trend following, momentum filtering, and adaptive risk management. It captures trend reversal points through EMA crossovers, filters extreme zone trading with RSI neutral zones, and employs ATR to dynamically adjust risk parameters, forming a logically complete trading framework.
The strategy's advantages lie in multi-indicator confirmation reducing false signals, adaptive risk management accommodating different market environments, and clear visualization of signals. However, it also has limitations such as poor performance in ranging markets and rapid reversal risks.
By adding trend strength filtering, implementing dynamic RSI thresholds, adopting trailing stops, optimizing risk-reward ratios, and other improvements, the strategy's robustness and adaptability can be further enhanced. Particularly, introducing more advanced market state recognition mechanisms would allow the strategy to flexibly adjust parameters and execution logic in different market environments.
Overall, this is a fundamentally sound, logically clear medium to long-term trend-following strategy framework suitable for further customization and optimization. It not only provides a trading signal generation mechanism but also includes a complete risk management system, offering a solid starting point for quantitative trading.
- 1