
Overview
The Dynamic Threshold Triple Running Moving Average Trend Trading Strategy is a quantitative trading method based on a multi-layered moving average system. This strategy utilizes three Running Moving Averages (RMAs) of different periods to determine market trend direction and identify trading opportunities. Additionally, the strategy incorporates the Relative Strength Index (RSI) and candlestick structure analysis to provide higher probability entry signals. The strategy features a dynamic threshold system that automatically adjusts according to different market types (Forex, Gold, and Cryptocurrency), allowing it to adapt to the volatility characteristics of various asset classes.
Strategy Principle
The core of this strategy is a three-layer RMA system and dynamic threshold detection mechanism:
-
Triple RMA System:
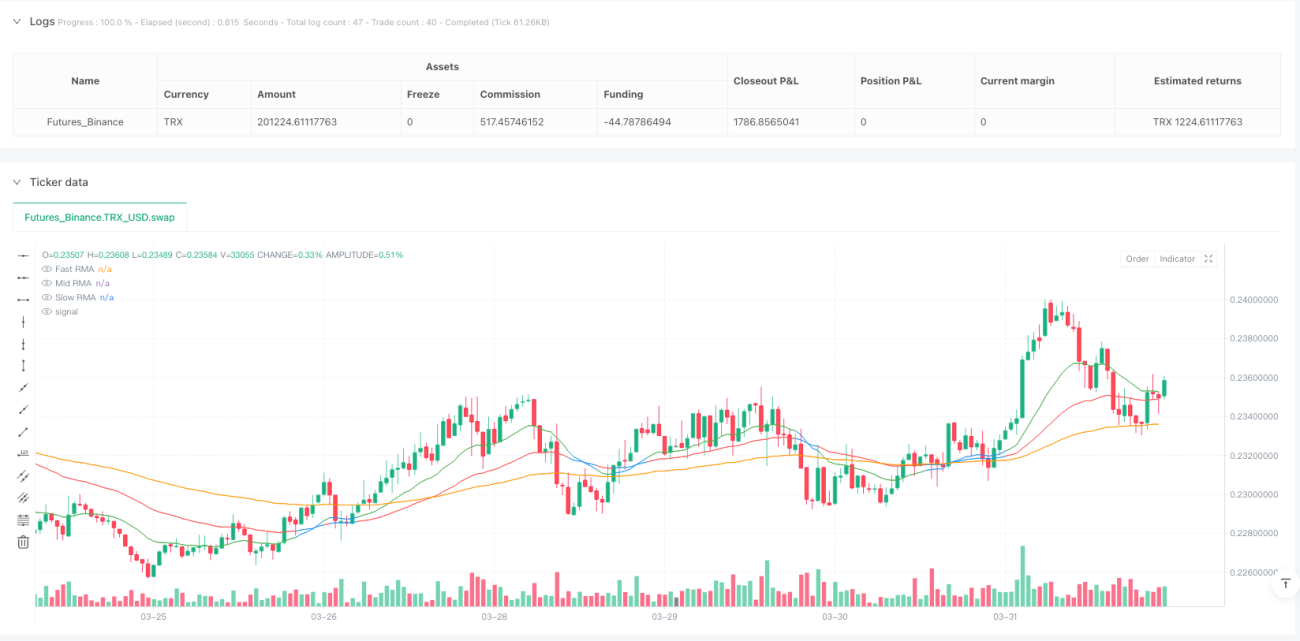
- Fast RMA (default 9 periods): Highly responsive to price changes, captures short-term momentum
- Mid RMA (default 21 periods): Filters market noise, confirms intermediate trends
- Slow RMA (default 50 periods): Represents overall market structure and bias
-
Trend Direction Determination:
- Bullish Structure: Fast RMA > Mid RMA > Slow RMA
- Bearish Structure: Fast RMA < Mid RMA < Slow RMA
-
Dynamic Threshold System:
- Sets appropriate weekly thresholds based on market type: Forex (0.12%), Gold (0.15%), Cryptocurrency (0.25%)
- Determines whether the market is in a significant trend by calculating the percentage distance between Fast RMA and Mid RMA
-
Entry Conditions:
- Long Signal: Bullish RMA structure + Close price crosses above Mid RMA + RSI > 50 + Current close breaks previous candle's high
- Short Signal: Bearish RMA structure + Close price crosses below Mid RMA + RSI < 50 + Current close breaks previous candle's low
-
Take Profit and Stop Loss Setup:
- Take Profit: Set at the Slow RMA level
- Stop Loss: Calculated based on user-defined points
Strategy Advantages
-
Adaptive Market Type:
- Through the market type selector, the strategy can automatically adjust threshold parameters based on the volatility characteristics of the trading asset
- Provides specially optimized parameter settings for markets with different volatility profiles such as Forex, Gold, and Cryptocurrency
-
Multi-layered Confirmation Mechanism:
- Combines triple moving averages, RSI momentum confirmation, and price structure breakouts to provide high-quality trading signals
- Effectively reduces false signals and low-probability trades through multiple condition filtering
-
Trend Strength Quantification:
- Dynamically assesses trend strength through RMA distance percentage, rather than using fixed parameters
- Flexibly adjusts in different volatility environments, avoiding frequent trading in consolidating markets
-
Visualization of Trend Status:
- Dynamically adjusts RMA line colors according to trend status, intuitively displaying market conditions
- When the market is in a strong trend, the Fast RMA displays in green and the Mid RMA in red, helping traders quickly identify market environment
-
Rational Take Profit and Stop Loss Mechanism:
- Uses Slow RMA as the take profit target, consistent with the mean-reverting characteristics of market trends
- Allows users to flexibly set stop loss points, balancing risk and drawdown control
Strategy Risks
-
False Signals in Oscillating Markets:
- Despite having a dynamic threshold system, false signals may still occur in severely oscillating markets
- May experience consecutive losing trades during early trend transitions, affecting the stability of the equity curve
-
Parameter Sensitivity:
- RMA lengths and threshold parameter settings significantly impact strategy performance
- Optimal parameters may vary greatly across different timeframes and market conditions, requiring continuous monitoring and adjustment
-
Fixed Stop Loss Risk:
- The strategy uses fixed points to set stop losses, which may be insufficient to protect capital in market conditions where volatility suddenly increases
- Does not consider market-specific structural positions (such as support and resistance levels) to optimize stop loss placement
-
Reliance on Historical Backtesting Parameters:
- Preset market type thresholds are based on historical data and may not be applicable to future market conditions
- Market characteristics change over time, and fixed thresholds may not continuously adapt
-
Signal Lag:
- RMA-based systems inherently have a certain lag, potentially missing optimal entry points in rapidly reversing markets
- During extreme market events, the strategy may not adjust positions quickly enough, suffering significant losses
Strategy Optimization Directions
-
Adaptive Threshold Optimization:
- Implement truly adaptive threshold calculations, rather than selection based on preset market types
- Can dynamically adjust trend determination thresholds by calculating the ratio of Average True Range (ATR) to price over the most recent N periods
-
Enhanced Stop Loss Mechanism:
- Introduce ATR-based dynamic stop losses to match stop loss levels with current market volatility
- Consider adding trailing stop functionality to lock in partial profits when trends develop favorably
-
Market State Classification Optimization:
- Add explicit logic for range/trend market determination to avoid generating false signals in consolidating markets
- Can optimize market state classification by detecting RMA line parallelism and trend strength indicators like ADX
-
Time Filter:
- Add time filtering functionality to avoid trading during important economic data releases or periods of insufficient liquidity
- Implement intraday/weekly optimized time window screening to adapt to the best trading sessions for different markets
-
Partial Profit Locking:
- Implement a stepped take-profit strategy to lock in profits in batches when price reaches specific movement distances
- This can improve overall risk-reward ratio, especially in long-term trend trading
-
Filter Tuning:
- Add volume confirmation conditions to ensure sufficient market participation when signals occur
- Consider introducing market volatility filters to reduce position size or pause trading in abnormally high volatility environments
Summary
The Dynamic Threshold Triple Running Moving Average Trend Trading Strategy is a well-structured quantitative trading system that provides an intelligent market adaptation mechanism through a three-layer RMA system and dynamic threshold judgment. The strategy combines the advantages of trend following, momentum confirmation, and price structure analysis, and is optimized for the volatility characteristics of different asset classes.
The main advantages of the strategy lie in its multi-layered confirmation mechanism and market adaptability, effectively reducing false signals and maintaining stability under different market conditions. However, it also faces risks such as false signals in oscillating markets and parameter sensitivity.
There is significant room for improvement through implementing adaptive threshold calculations, enhancing stop loss mechanisms, and optimizing market state classification. Particularly, dynamic stop losses and profit locking features based on ATR can significantly improve risk management capabilities, maintaining strategy robustness across various market environments.
For quantitative investors pursuing trend trading, this strategy provides a solid framework that can be further customized and optimized according to individual risk preferences and capital management principles.
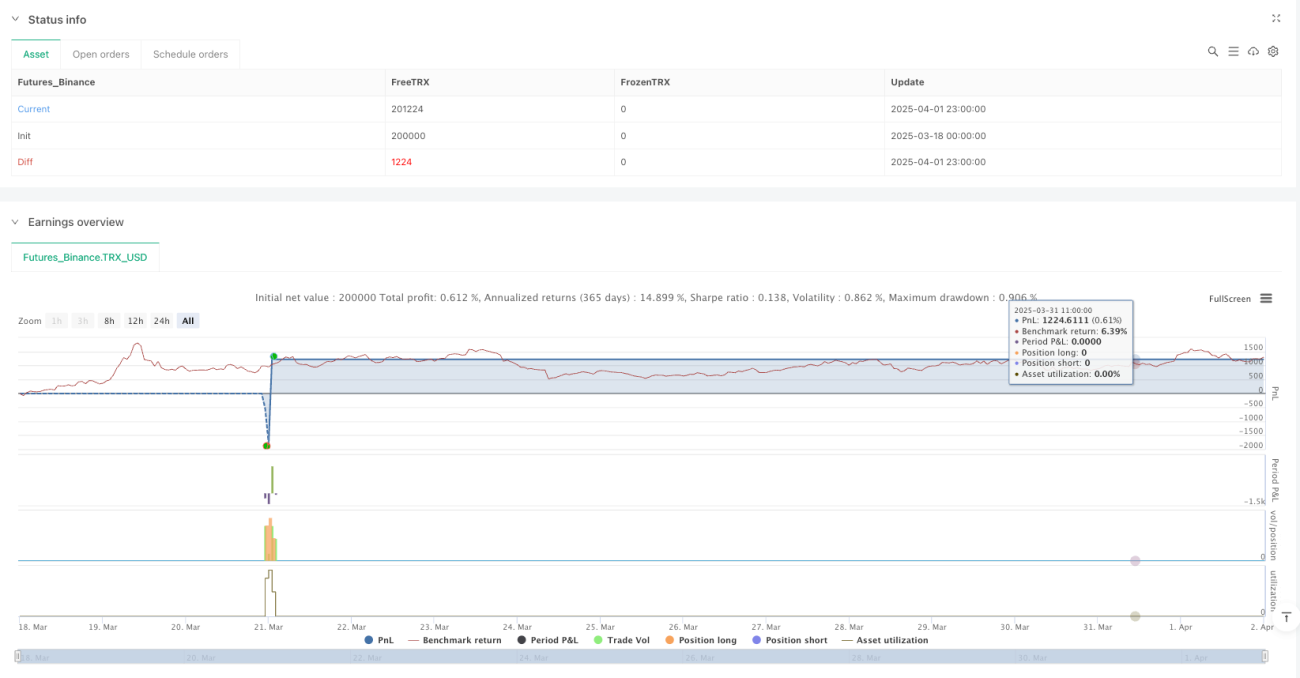
/*backtest
start: 2025-03-18 00:00:00
end: 2025-04-02 00:00:00
period: 1h
basePeriod: 1h
exchanges: [{"eid":"Futures_Binance","currency":"TRX_USD"}]
*/

//@version=5
strategy("RMA Strategy - Weekly Dynamic Thresholds", overlay=true, default_qty_type=strategy.percent_of_equity, default_qty_value=100)

// === User Inputs ===- 1