Multi-Timeframe Trend-Confirmed Quantitative Breakout Trading Strategy

Overview
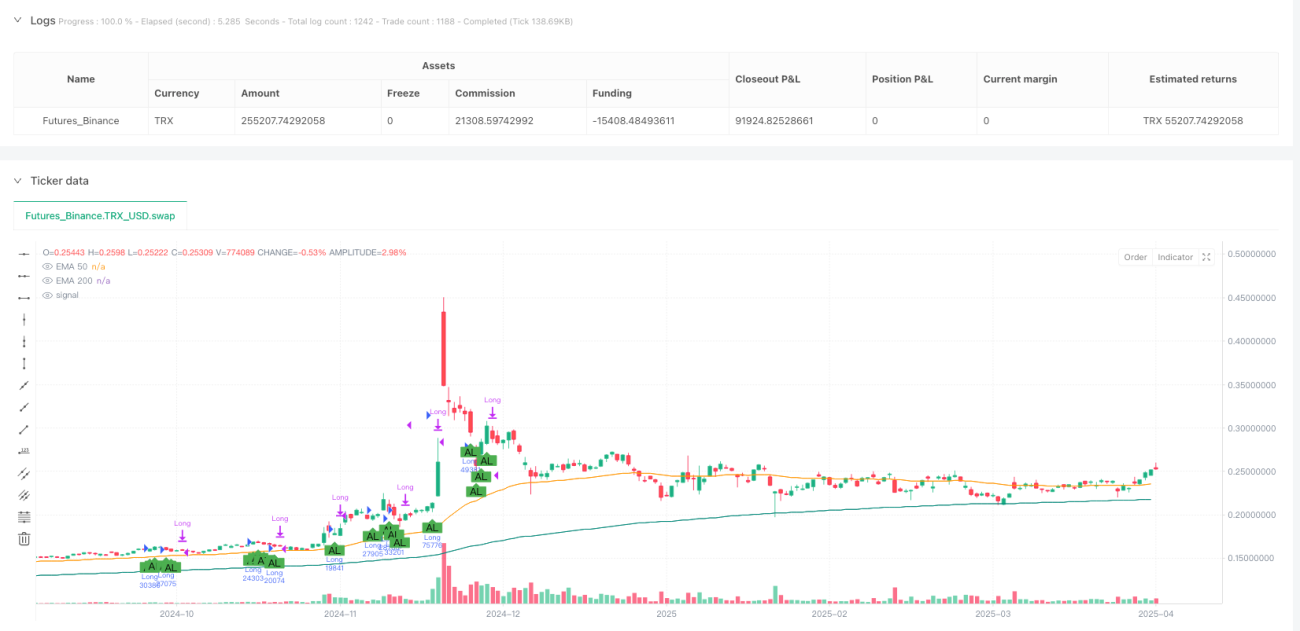
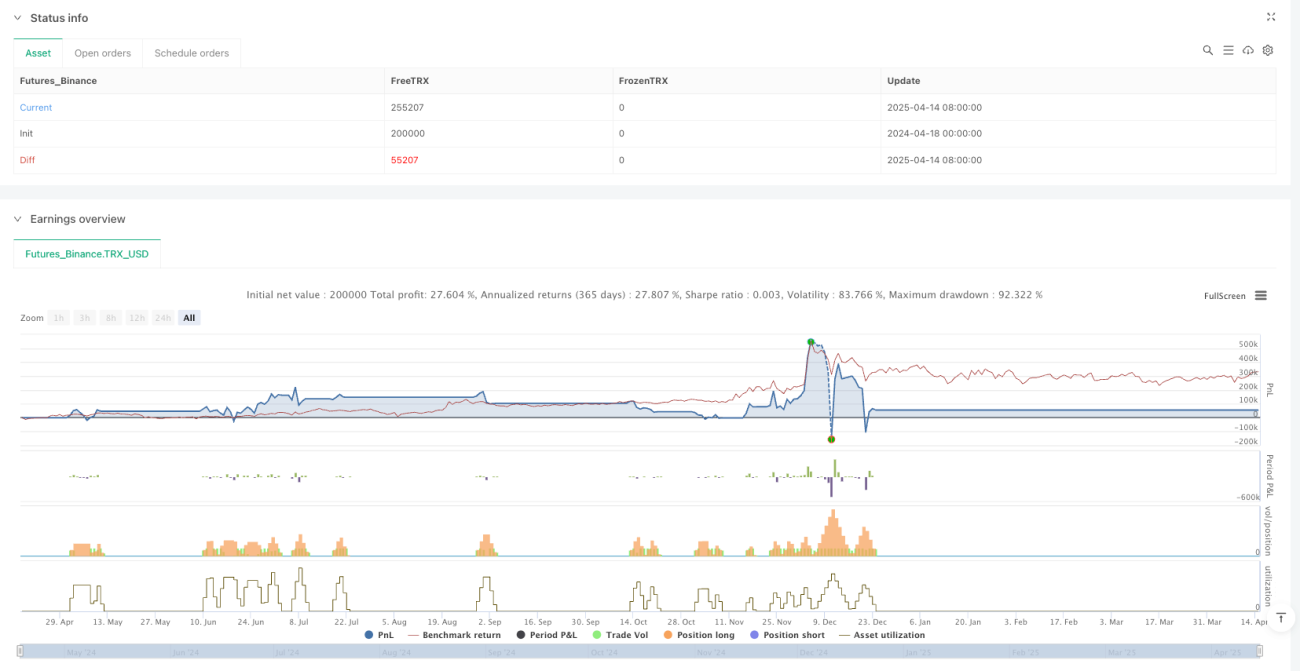
The "Multi-Timeframe Trend-Confirmed Quantitative Breakout Trading Strategy" is a comprehensive quantitative trading system that combines multiple technical indicators and timeframe analysis. The core of this strategy lies in identifying high-probability breakout trading opportunities through multiple filtering conditions while implementing strict risk management mechanisms. The strategy utilizes trend indicators (EMA, SuperTrend), momentum indicators (RSI, MACD), trend strength indicators (ADX, DMI), and multi-timeframe (MTF) confirmation to build a comprehensive trading decision framework. This strategy is applicable on the TradingView platform, written in Pine Script v5, and can be used for backtesting analysis and real-time trading signal generation.
Strategy Principles
The trading logic of this strategy is built on the synergistic effect of several key technical indicators:
-
Trend Confirmation: Uses 50-period and 200-period Exponential Moving Averages (EMA50 and EMA200) to determine the current market trend direction. Long conditions require both price and EMA50 to be above EMA200; short conditions require the opposite.
-
Momentum Filtering: Utilizes Relative Strength Index (RSI) and MACD histogram for momentum confirmation. Long trades require RSI between 40-70 and a positive MACD histogram; short trades require RSI between 30-60 and a negative MACD histogram.
-
Multi-Timeframe Analysis: Achieves cross-timeframe trend confirmation by requesting EMA data from a higher timeframe (1 hour). Long positions require 1-hour EMA50 > EMA200; short positions require 1-hour EMA50 < EMA200.
-
Trend Strength Validation: Uses Average Directional Index (ADX) and SuperTrend indicator to ensure the trend has sufficient strength at entry. The strategy requires ADX to be above a user-defined threshold (default 20), with SuperTrend direction aligned with the trade direction.
-
Volume Confirmation: Optionally enables a volume filter to ensure entry with significant trading volume support. This filter requires current volume to be greater than the 20-period simple moving average of volume.
-
Dynamic Risk Management: Calculates position size based on Average True Range (ATR) and sets stop-loss/take-profit levels using percentages. This is achieved through the formula: Position Size = (Account Size * Risk Percentage) / ATR.
-
Automated Exit Mechanisms: The strategy includes two exit mechanisms - fixed exit points based on take-profit/stop-loss percentages and conditional exits based on indicator reversals (such as MACD histogram turning or RSI exceeding specific ranges).
Strategy Advantages
-
Multiple Confirmation Mechanisms: By combining multiple technical indicators and timeframe analysis, the strategy significantly improves the reliability of trading signals and reduces losses from false breakouts.
-
Adaptive Risk Management: Position size calculation based on ATR allows the strategy to automatically adjust risk exposure according to market volatility, maintaining consistent risk levels in different volatility environments.
-
Multi-Timeframe Consistency: Through higher timeframe trend confirmation, the strategy can avoid counter-trend operations, improving trade win rate and efficiency.
-
Flexible Parameter Settings: The strategy allows users to customize key parameters such as risk percentage, take-profit/stop-loss levels, ADX threshold, etc., adapting to different trading styles and risk preferences.
-
Visual Interface: The built-in dashboard provides real-time strategy status and key indicator data, helping traders quickly evaluate market conditions and strategy performance.
-
Multiple Exit Strategies: Using both fixed percentage take-profit/stop-loss and conditional exits provides more comprehensive protection for trades, both locking in profits and timely avoiding adverse market changes.
-
Alert System Integration: Built-in alert conditions facilitate integration with automated trading bots or Telegram signal groups, enabling semi-automated trading operations.
Strategy Risks
-
Indicator Lag: The moving averages and other technical indicators used inherently have lag, which may lead to delayed reactions in rapidly changing markets, resulting in suboptimal entry points or missed important exit points.
Solution: Incorporate shorter-period indicators or price action analysis as supplements to improve the strategy's response speed.
-
Over-Filtering Risk: While multiple conditions improve signal quality, they may also reduce trading opportunities, especially in low-volatility market environments.
Solution: Dynamically adjust parameters according to different market environments, appropriately relaxing condition requirements in ranging markets.
-
Parameter Sensitivity: Strategy performance is highly dependent on various parameter settings, such as EMA periods and ADX threshold. Improper parameter selection may lead to significant decline in strategy effectiveness.
Solution: Conduct comprehensive parameter optimization and backtesting to find parameter combinations that perform stably across various market environments.
-
Stop-Loss Trigger Risk: In highly volatile markets, prices may temporarily break through stop-loss levels and then reverse, causing unnecessary stop-loss exits.
Solution: Consider using ATR-based dynamic stop-losses or multi-timeframe confirmed stop-loss strategies to reduce "shake-out" phenomena.
-
Multi-Timeframe Conflicts: Signals from different timeframes may contradict each other, causing strategy confusion.
Solution: Establish clear timeframe priority rules or develop more sophisticated multi-timeframe coordination mechanisms.
Optimization Directions
-
Machine Learning Parameter Optimization: Introduce machine learning algorithms to dynamically optimize strategy parameters, automatically adjusting key parameters such as EMA periods and RSI thresholds based on different market environments. This optimization can help the strategy better adapt to market structure changes and improve long-term stability.
-
Market State Classification: Add a market state identification module to distinguish between trending and ranging markets, then apply different parameter settings or trading logic for different market states. This addresses the challenge of single parameter combinations struggling to optimize across all market environments simultaneously.
-
Dynamic Timeframe Selection: Develop an adaptive timeframe selection mechanism that automatically adjusts indicator periods and multi-timeframe reference periods based on market volatility. This is crucial for adapting to different market rhythms.
-
Enhanced Exit Mechanisms: Optimize exit logic by adding partial profit locking, trailing stops, and volatility-based dynamic stop-loss strategies. More sophisticated exit mechanisms can better protect gains and reduce unnecessary early exits.
-
Sentiment Indicator Integration: Consider adding market sentiment indicators such as VIX, implied option volatility, or On-Balance Volume (OBV) to gain more information about market conditions. Market sentiment data can serve as important supplements to trading signals.
-
Risk Parity Position Management: Implement more complex risk parity mechanisms, considering correlations between different markets to optimize risk allocation at the portfolio level. This is particularly useful when trading across multiple markets simultaneously.
-
Add Predictive Indicators: Introduce predictive indicators such as Elliott Waves, Relative Strength Comparison, or KST Oscillator to enhance the strategy's forward-looking capability. Predictive indicators can help the strategy identify trend turning points earlier.
Conclusion
The "Multi-Timeframe Trend-Confirmed Quantitative Breakout Trading Strategy" is a comprehensively designed quantitative trading strategy that establishes a robust trading decision system through multi-level technical indicators and timeframe analysis. The core advantages of the strategy lie in its strict entry condition screening and comprehensive risk management framework. Through the synergistic effect of indicators such as EMA, RSI, MACD, SuperTrend, and ADX, as well as multi-timeframe consistency verification, the strategy effectively reduces the risk of false breakout trades.
Although the strategy has considered multiple factors in its design, inherent risks such as parameter sensitivity and indicator lag still exist. By introducing machine learning optimization, market state classification, dynamic parameter adjustment, and other optimization directions, the strategy can further enhance its adaptability and stability. Particularly in environments where market conditions change rapidly, intelligent parameter adjustment will significantly improve strategy performance.
Overall, this strategy is suitable for medium to long-term investors who have a certain understanding of technical analysis and are seeking systematic trading methods. Through the TradingView platform and Pine Script, investors can conveniently backtest and optimize strategy parameters, and also utilize the built-in alert system to implement semi-automated trading operations. In practical application, it is recommended to combine macroeconomic market analysis and fundamental research as important components of a complete trading system.
- 1