
Overview
The EMA Crossover Dynamic Trailing Stop-Loss Strategy is a quantitative trading approach that combines EMA crossover signals with a dynamic trailing stop-loss mechanism. This strategy utilizes the crossover between short-term and long-term Exponential Moving Averages (EMAs) to identify potential trend changes, while simultaneously employing a dynamically adjusting trailing stop-loss mechanism to protect profits and limit downside risk. This combination not only provides clear entry and exit signals but also optimizes risk management through automatically adjusted stop levels, making it both a simple and effective trading method.
The core of this strategy relies on the relationship between the short-term EMA and long-term EMA to determine market trends. When the short-term EMA crosses above the long-term EMA, a buy signal is generated; when the short-term EMA crosses below the long-term EMA, a sell signal is triggered. Once a trade is entered, the dynamic trailing stop-loss mechanism begins working, automatically adjusting the stop level as the price moves favorably, which helps lock in profits and manage risk for each trade.
Strategy Principles
The technical principles of this strategy can be divided into several key components:
-
EMA Calculation and Crossover Detection: The strategy employs two Exponential Moving Averages with different periods—by default, a 9-period short EMA and a 21-period long EMA. The crossovers between these two lines generate trading signals. Using the
ta.crossoverandta.crossunderfunctions, the strategy detects when the short EMA crosses above the long EMA (triggering a buy signal) and when the short EMA crosses below the long EMA (triggering a sell signal). -
Dynamic Trailing Stop-Loss Mechanism: This is the core risk management component of the strategy. Once a long position is entered, the strategy records and continuously updates the highest price (
highestPrice) encountered during the trade. Based on this highest price and a user-defined trailing stop percentage (default 1%), it calculates a dynamic stop-loss price (trailStopPrice). When the current price falls below this stop price, the long position is closed. Similarly, for short positions, the strategy tracks the lowest price and adjusts the stop level accordingly. -
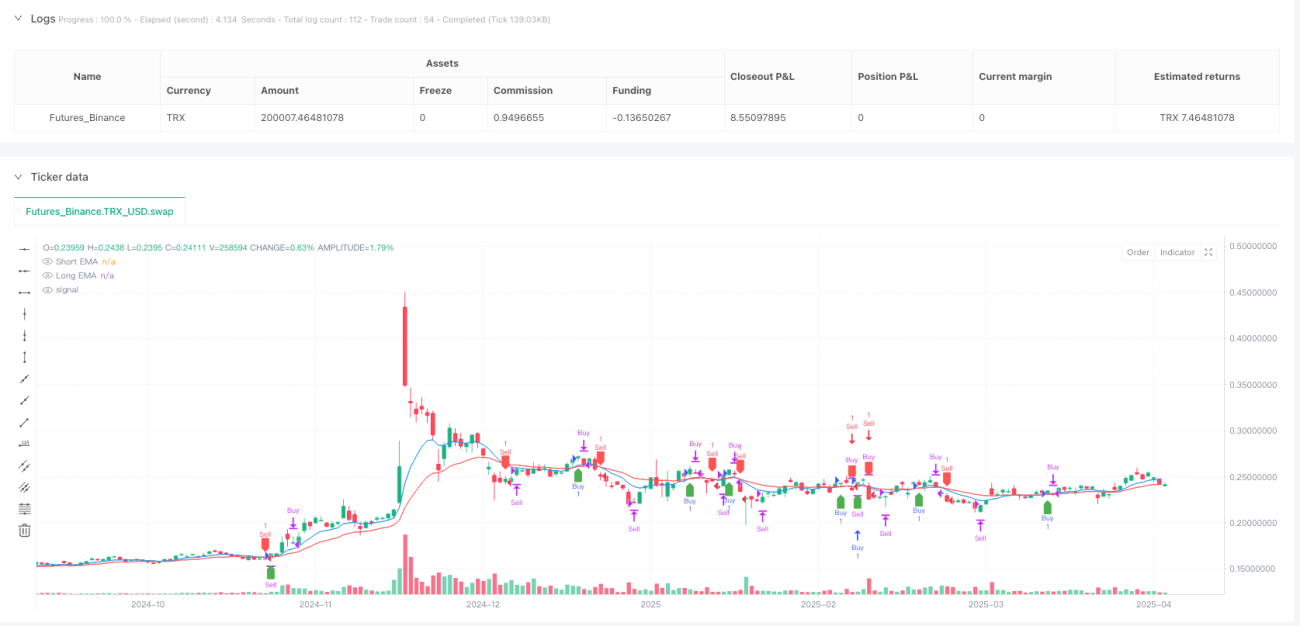
Visualization and Alert System: The strategy displays buy signals as green upward labels and sell signals as red downward labels on the price chart, allowing traders to visually identify entry and exit points. Additionally, the strategy sets up alert conditions to send real-time notifications when buy or sell signals are generated, ensuring traders don't miss potential trading opportunities.
-
Strategy Execution Logic: When buy conditions are met, the strategy executes a long position; when sell conditions are met, it executes a short position. The trailing stop logic continuously monitors price movements and closes positions at appropriate times to protect capital.
Strategy Advantages
After analyzing the code of this strategy, the following clear advantages can be summarized:
-
Concise yet Powerful Signal System: EMA crossovers are a time-tested method for trend identification, easy to understand and effective across various market conditions. The strategy uses this simple crossover signal, reducing subjectivity and complexity in trading decisions.
-
Dynamic Risk Management: The trailing stop mechanism is a major highlight of this strategy. Compared to fixed stop-loss points, it allows profitable trades more room to fluctuate while locking in partial profits as the price moves favorably. This dynamic stop-loss method is particularly suitable for capturing trending markets.
-
High Customizability: The strategy allows users to adjust the periods of both short and long EMAs as well as the trailing stop percentage. This flexibility enables traders to optimize strategy parameters according to different market conditions, trading instruments, and timeframes.
-
Real-time Alert Functionality: The built-in alert system ensures that traders can receive timely notifications of trading signals, even if they cannot continuously monitor the market. This is particularly valuable for part-time traders or those managing multiple markets.
-
Visualized Trading Signals: The strategy visually marks buy and sell signals directly on the price chart, allowing traders to quickly assess the historical performance of the strategy and verify potential trading opportunities.
Strategy Risks
Despite being well-designed, the strategy still has the following potential risks and challenges:
-
False Signals in Ranging Markets: In sideways or highly volatile markets without clear trends, EMA crossover strategies may generate frequent false signals, leading to a series of losing trades. This is a common weakness of all trend-following strategies. Solutions may include adding additional filtering conditions (such as volatility indicators or trend strength indicators) or pausing trading during specific market conditions.
-
Overfitting Risk in Parameter Optimization: Excessive optimization of EMA periods and trailing stop percentages may lead to a strategy that performs excellently on historical data but poorly in future live trading. This risk should be mitigated through robust backtesting across different time periods and markets.
-
Lack of Entry Confirmation Mechanism: The current strategy relies solely on EMA crossovers to generate signals without additional confirmation indicators, which may trigger unnecessary trades during false breakouts or temporary fluctuations. Introducing additional confirmation indicators (such as volume, RSI, or MACD) can improve signal quality.
-
Sensitivity of Trailing Stop Parameters: Setting the trailing stop percentage too small may trigger exits during normal market fluctuations, while setting it too large may result in losing too much realized profit during market reversals. This parameter needs to be carefully adjusted according to the volatility characteristics of the trading instrument.
-
Market Gap Risk: During major news releases or overnight, markets may experience significant price gaps, causing actual stop-loss prices to be far lower (in long positions) or higher (in short positions) than the expected trailing stop levels. It is recommended to use fixed stop-loss orders in conjunction with trailing stops in live trading to guard against extreme market volatility.
Strategy Optimization Directions
Based on an in-depth analysis of the code, here are possible optimization directions:
-
Add Trend Filters: Introducing trend strength indicators (such as ADX or Trend Direction Index) as additional filtering conditions and only trading in confirmed trending environments can significantly reduce false signals. This could be implemented by only executing trade signals when the ADX value exceeds a specific threshold (such as 25).
-
Integrate Volume Analysis: Incorporating volume indicators into the signal generation logic, only confirming signals when EMA crossovers are accompanied by higher volume, helps confirm the validity and strength of trend changes.
-
Dynamically Adjust EMA Periods: Automatically adjusting EMA periods based on market volatility, using longer periods in high-volatility environments to reduce noise and shorter periods in low-volatility environments to improve responsiveness. This can be implemented by calculating recent ATR (Average True Range) and establishing a mapping relationship with EMA periods.
-
Optimize Trailing Stop Logic: Several improvements can be considered:
- Set dynamic trailing stop distances based on ATR, adapting to volatility in different market conditions.
- Implement segmented trailing stops, gradually tightening the stop percentage as profits increase for more effective profit locking.
- Add time-based stop adjustments, allowing different trailing stop strategies to be applied at different holding time intervals.
-
Add Profit Target Mechanism: By setting partial take-profit targets, closing part of the position when reaching specific profit levels both locks in partial profits and allows the remaining position to continue following the trend. This pyramiding position management can optimize the overall risk-reward ratio.
-
Periodic Performance Testing and Adaptive Parameters: Implement automated backtesting functionality to periodically evaluate different parameter combinations on recent market data and automatically adjust to the optimal parameter set. This adaptive mechanism can help the strategy evolve with changing market conditions.
Conclusion
The EMA Crossover Dynamic Trailing Stop-Loss Strategy is a quantitative trading system that combines classic technical analysis methods with modern risk management techniques. It uses EMA crossover signals to capture trend changes and protects capital and profits through a dynamic trailing stop-loss mechanism. The core advantages of this strategy lie in its simplicity, understandability, and customizability, making it applicable to various markets and trading styles.
However, like all trading strategies, it also faces challenges related to changing market conditions and parameter optimization. By introducing additional filters, integrating volume analysis, optimizing trailing stop logic, and implementing adaptive parameter adjustments, the robustness and adaptability of the strategy can be further enhanced.
Ultimately, the successful application of this strategy depends on the trader's understanding of the market, awareness of strategy limitations, and willingness to continuously improve and optimize. No matter how advanced a strategy is, it needs to be complemented with strict money management and emotional control to achieve long-term success in complex and changing market environments.
- 1