
Overview
The Multi-Indicator Momentum Strategy with EMA Crossover and Risk Management is a quantitative trading system that combines multiple technical indicators, primarily based on Exponential Moving Average (EMA) crossovers, Relative Strength Index (RSI), and Moving Average Convergence Divergence (MACD) signals to determine entry points. The strategy includes fixed percentage Stop Loss (SL) and Take Profit (TP) mechanisms for risk management on each trade. The core logic is to capture price momentum changes and execute trades when technical indicators align, using multiple confirmations to improve signal reliability while strictly controlling the risk-to-reward ratio for each trade.
Strategy Principles
This strategy is based on the comprehensive analysis of three core technical indicators:
-
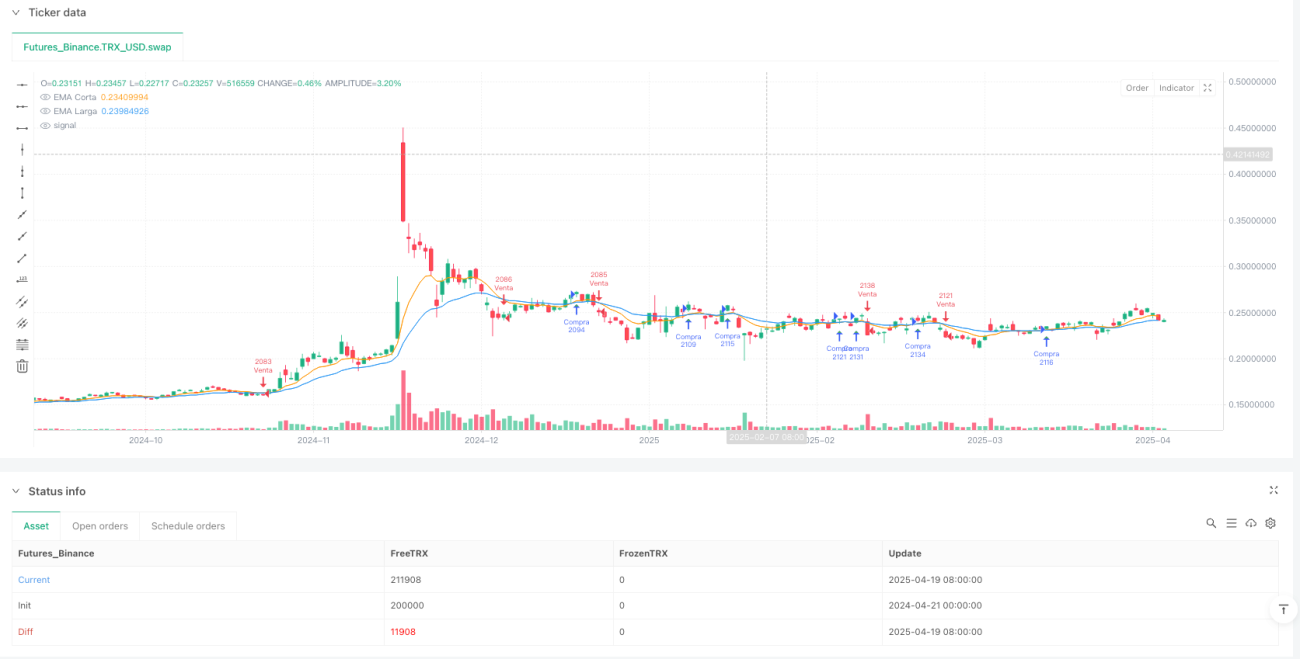
Exponential Moving Average (EMA) Crossover: Uses a short-term EMA (9-period) and a long-term EMA (21-period). A buy signal is generated when the short-term EMA crosses above the long-term EMA, and a sell signal when it crosses below. EMA crossovers reflect potential trend reversals.
-
Relative Strength Index (RSI): Uses a 14-period RSI indicator. Values above 50 confirm upward momentum, while values below 50 confirm downward momentum. As a momentum indicator, RSI helps identify overbought or oversold market conditions.
-
MACD Indicator: Uses standard parameters (12,26,9). The uptrend is confirmed when the MACD line is above the signal line, and the downtrend is confirmed when it's below.
Long entry conditions require simultaneous fulfillment of:
- Short-term EMA crossing above long-term EMA
- RSI value greater than 50
- MACD line positioned above the signal line
Short entry conditions require simultaneous fulfillment of:
- Short-term EMA crossing below long-term EMA
- RSI value less than 50
- MACD line positioned below the signal line
Each trade has fixed percentage stop loss and take profit levels:
- Stop loss is set at 1% from the entry price
- Take profit is set at 2% from the entry price
The strategy defaults to using 10% of the account equity for each trade, a money management approach that helps control single-trade risk.
Strategy Advantages
-
Multiple Confirmation Mechanism: Combines trend indicators (EMA), momentum indicators (RSI), and oscillators (MACD) to form a triple-filter mechanism, effectively reducing the risk of false breakouts and improving the reliability of trading signals.
-
Clear Risk Management: Each trade has predetermined stop loss and take profit points, with a fixed risk-to-reward ratio of 1:2, adhering to healthy trading risk management principles.
-
Automated Execution: The strategy is fully automated, eliminating emotional interference and consistently executing the trading plan.
-
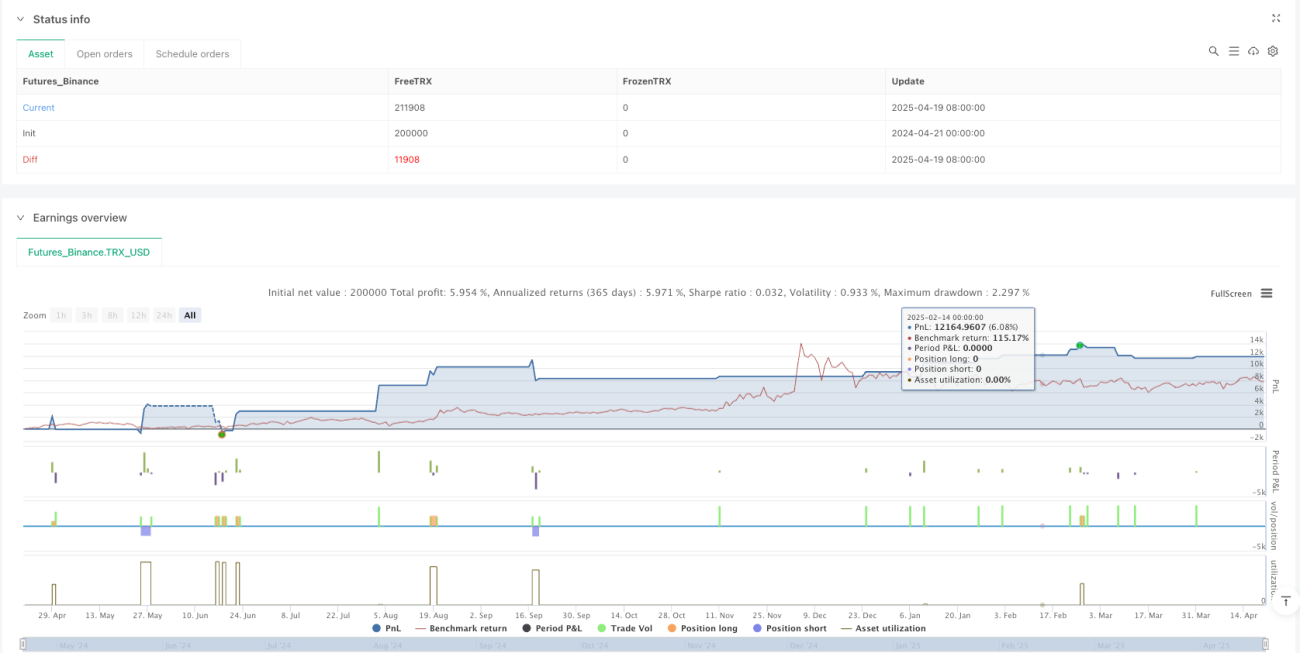
Clear Visual Feedback: By plotting trading signals and moving averages, it provides intuitive visual feedback for backtesting analysis and strategy optimization.
-
Integrated Money Management: Default use of 10% of account funds per trade prevents excessive leverage-induced capital risk.
-
High Adaptability: Core parameters are customizable, allowing the strategy to adapt to different market environments and personal trading preferences.
Strategy Risks
-
Poor Performance in Ranging Markets: In consolidation phases or markets without clear trends, EMA crossovers may generate frequent false signals, leading to consecutive small losses. The solution is to add a trend strength filter, such as the ADX indicator, to trade only in clearly trending markets.
-
Fixed Stop Loss May Be Insufficient: The 1% fixed stop loss range may be too small in some high-volatility markets and easily triggered by market noise. It's recommended to dynamically adjust the stop loss percentage based on market volatility, such as using the ATR indicator to set stop loss positions.
-
Fixed Parameters Lack Adaptability: Current strategy parameters are fixed values that may not be suitable for all market environments. Consider implementing parameter adaptive mechanisms that automatically adjust indicator parameters based on market conditions.
-
Over-reliance on Technical Indicators: The strategy is entirely based on technical indicators, ignoring fundamental and market structure factors. Consider adding market structure analysis or integrating fundamental filters.
-
Lack of Trading Time Filters: Some market sessions have higher volatility or lower liquidity, potentially increasing slippage. Consider adding trading time window filters to avoid inefficient trading periods.
-
Transaction Costs Not Considered: Fees and slippage in actual trading may significantly impact strategy profitability. Transaction costs should be fully considered in backtesting and live trading.
Strategy Optimization Directions
-
Dynamic Risk Management: Replace fixed percentage stops with ATR-based (Average True Range) dynamic stops to better adapt to changing market volatility. For example, set the stop loss at entry price minus 2 times the current ATR value, allowing for wider stops in high-volatility environments and tighter stops in low-volatility environments.
-
Add Trend Strength Filtering: Integrate ADX (Average Directional Index) as a trend strength filter, only trading when the ADX value exceeds a specific threshold (e.g., 25) to avoid frequent trading in ranging markets.
-
Optimize Entry Timing: Consider adding price pullback entry logic after EMA crossover confirmation, such as waiting for the price to pull back to near the short-term EMA before entering, to achieve better entry prices.
-
Implement Partial Stop Loss Strategy: Implement a tiered stop loss approach, moving the stop loss to breakeven or to a profitable position when the price moves a specific distance in the favorable direction, locking in partial profits.
-
Parameter Optimization and Adaptation: Conduct historical optimization of EMA periods, RSI, and MACD parameters, or implement parameter adaptive mechanisms that automatically adjust parameter settings based on market conditions.
-
Consider Volume Confirmation: Add volume analysis, requiring sufficient volume support when signals are triggered to filter out low-quality crossover signals.
-
Integrate Market Environment Analysis: Adjust strategy modes based on market volatility or trend strength. For example, use more conservative position management or looser stop loss settings in high-volatility environments.
Summary
The Multi-Indicator Momentum Strategy with EMA Crossover and Risk Management is a clearly structured, logically rigorous quantitative trading system that identifies potential trend reversal points through triple indicator confirmation with EMA crossovers, RSI, and MACD, while incorporating preset risk management mechanisms. The strategy's main advantages are its multiple indicator confirmations and clear risk control, though it may face false signal issues in ranging markets.
By introducing dynamic stops, trend strength filtering, and parameter adaptation, this strategy has the potential to further improve its robustness and adaptability. For traders pursuing technically-driven, disciplined medium to short-term trading, this is a worthwhile basic strategy framework that can be further customized and improved based on individual trading styles and target market characteristics.
It's worth noting that any trading strategy requires thorough historical backtesting and simulated trading before actual application, and should be gradually validated in live environments with small positions. Regular reassessment and adjustment of strategy parameters as market conditions change is also key to maintaining its effectiveness.
/*backtest
start: 2024-04-21 00:00:00
end: 2025-04-20 00:00:00
period: 1d
basePeriod: 1d
exchanges: [{"eid":"Futures_Binance","currency":"TRX_USD"}]
*/

//@version=5
strategy("Estrategia EMAs + RSI + MACD con SL y TP", overlay=true, default_qty_type=strategy.percent_of_equity, default_qty_value=10)

// === Parámetros ===- 1