Multi-Indicator Integrated Order Flow Trading Automation Equilibrium Strategy System

Overview
The Order Flow Trading Strategy System is a quantitative trading approach based on market microstructure analysis, which captures the dynamic changes in market supply and demand forces by analyzing active buy and sell volumes at each price level. This strategy integrates core elements of order flow, including Delta (difference between buying and selling pressure), POC (Point of Control), supply-demand imbalance ratio, and volume characteristic changes to build a comprehensive trading system. By identifying high-probability signals such as stacked imbalances, micro order reversals, and absorption breakouts, combined with precise risk control mechanisms, this strategy aims to capture trend initiations and reversal points to achieve stable trading returns.
Strategy Principles
The core principle of this strategy is to decode the internal supply-demand structure of the market and identify key moments of power shifts between buyers and sellers. The implementation mechanisms are as follows:
-
Order Flow Indicator Calculation:
- Simulation of active buy/sell volumes using the volume of rising/falling candles as a simplified substitute
- Delta value calculation: Difference between up volume (upVol) and down volume (downVol)
- POC (Point of Control): Determined by identifying maximum volume over a specified lookback period
- Supply-demand imbalance determination: When the ratio of buy to sell volume exceeds a set threshold (e.g., 3:1)
- Stacked imbalance calculation: Formation of stacked imbalance zones when multiple consecutive candles show imbalances in the same direction
-
Trading Signal Generation:
- Micro order reversal signals: Identified by combining the lowest volume point in the short term with Delta direction
- Stacked imbalance support/resistance: Formed when multiple consecutive candles create imbalances in the same direction
- Absorption and breakout signals: Significant volume expansion after range consolidation, indicating directional breakouts
-
Entry Logic:
- Long conditions: Stacked imbalance support + micro buy reversal + positive Delta expansion, or absorption followed by Delta expansion
- Short conditions: Stacked imbalance resistance + micro sell reversal + negative Delta expansion, or absorption followed by negative Delta expansion
-
Risk Management:
- Stop-loss and take-profit based on minimum tick movement (MinTick)
- Percentage-based position sizing to control single-trade risk exposure
Strategy Advantages
-
Microstructure Analysis Capability: By analyzing the internal structure of order flow, the strategy can identify battle details within price that traditional candlestick charts cannot display, capturing market turning points in advance.
-
Strong Real-time Response: Makes judgments directly based on current market behavior rather than relying on lagging indicators, enabling timely responses to market changes.
-
Multi-dimensional Signal Confirmation: Combines multiple order flow indicators (Delta, imbalance, POC, micro orders, stacking) to form a multi-confirmation mechanism, improving signal reliability.
-
Adaptive Market Structure Recognition: Does not rely on fixed price levels, but identifies support and resistance based on real-time supply-demand dynamics, providing greater adaptability.
-
Precise Risk Control: Sets stop-loss positions based on market microstructure, avoiding arbitrary stops and improving capital efficiency.
-
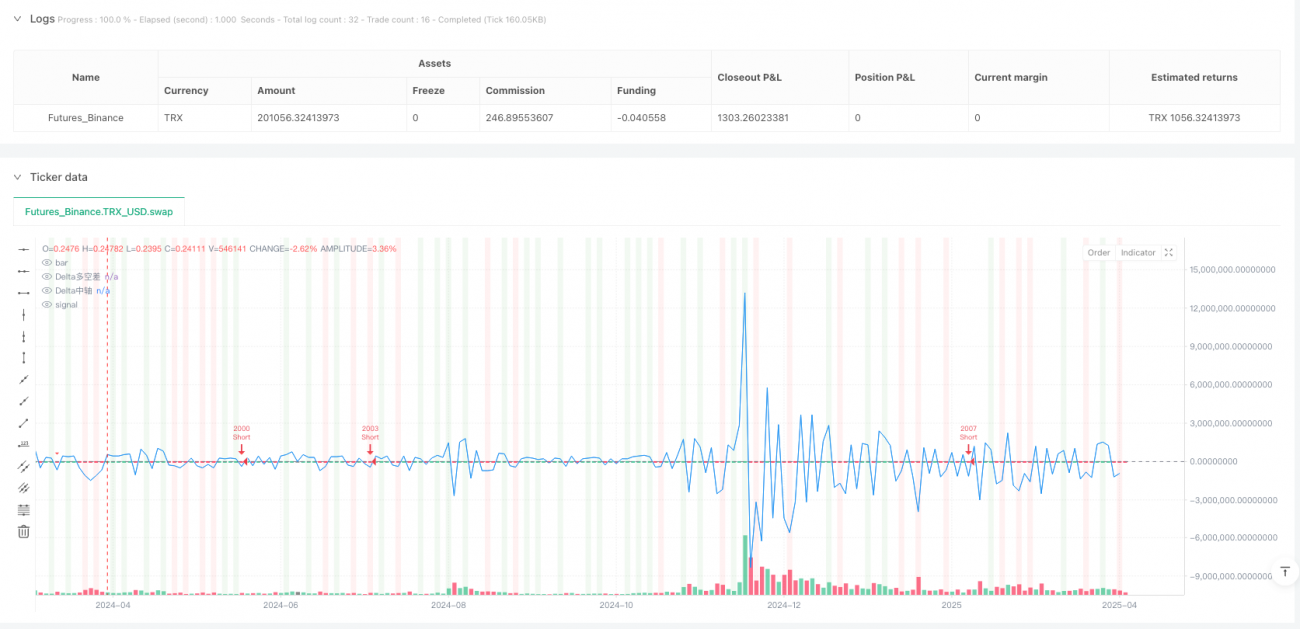
Visual Feedback System: Provides intuitive display of strategy operation status and market structure through Delta curve plotting, signal marking, and background color changes.
-
Parameter Adjustability: Offers multiple customizable parameters (Delta threshold, imbalance ratio, stacking count, etc.) that can be optimized according to different market characteristics.
Strategy Risks
-
Data Dependency Risk:
- The strategy uses candlestick data to simulate order flow rather than real Level 2 tick-by-tick data, which may introduce certain biases
- Solution: Connect to real tick-by-tick trading data when conditions permit to improve data accuracy
-
Market Environment Adaptability Risk:
- Order flow signals may fail or generate false signals in extremely low volatility or one-sided market conditions
- Solution: Add market environment filtering conditions to automatically stop trading in unsuitable market environments
-
Parameter Sensitivity Risk:
- Different parameter combinations may significantly impact strategy performance, risking overfitting to historical data
- Solution: Use forward validation and robust parameter settings to avoid over-optimization
-
Signal Timeliness Risk:
- Order flow signals typically require prompt execution; delayed execution may significantly reduce effectiveness
- Solution: Optimize the execution system to ensure rapid execution after signal generation
-
Liquidity Risk:
- Strategy performance may be poor in low-liquidity markets where insufficient volume affects order flow analysis
- Solution: Restrict trading to time periods and instruments with sufficient liquidity
Strategy Optimization Directions
-
Order Flow Data Precision Improvement:
- Connect to real Level 2 tick data to replace the current candlestick simulation method
- Optimization rationale: Improve the accuracy of order flow analysis to capture more subtle market structure changes
-
Multi-timeframe Collaborative Analysis:
- Integrate order flow signals from multiple timeframes to form a time-frame collaborative confirmation mechanism
- Optimization rationale: Reduce false signals that may be generated by a single timeframe and increase trading certainty
-
Machine Learning Enhancement:
- Introduce machine learning algorithms to automatically identify the most effective order flow patterns and parameter combinations
- Optimization rationale: Discover more complex order flow patterns and improve model adaptability and prediction accuracy
-
Market Volatility Adaptive Mechanism:
- Dynamically adjust parameters such as Delta threshold and imbalance ratio based on market volatility
- Optimization rationale: Adapt to different market conditions and maintain strategy stability across various environments
-
Micro Order Identification Algorithm Improvement:
- Develop more precise micro order identification algorithms to distinguish between genuine volume exhaustion and random fluctuations
- Optimization rationale: Improve the accuracy of micro order reversal signals and reduce false signals
-
Composite Signal Weighting System:
- Establish a dynamic weighting system for various order flow signals, adjusting signal importance based on historical performance
- Optimization rationale: Optimize multi-signal combination effects and focus on the most effective signal types in the current market environment
Summary
The Multi-Indicator Integrated Order Flow Trading Automation Equilibrium Strategy System provides an effective supplement and breakthrough to traditional technical analysis by deeply analyzing market microstructure. The strategy focuses not only on price movements but also on the supply-demand power balance behind prices, enabling it to identify market sentiment shifts and institutional money flow. By integrating multi-dimensional indicators such as Delta, POC, imbalance ratio, stacked imbalances, and micro order reversals, it builds a comprehensive trading decision system.
The core advantages of the strategy lie in its ability to decode market microstructure and its real-time nature, capturing trading opportunities that traditional charts may miss. Meanwhile, through strict risk control and precise entry and exit mechanisms, it pursues a high reward-to-risk ratio on a solid foundation. Although there are risks such as data dependency and parameter sensitivity, through continuous optimization and improvement, especially in areas like order flow data quality, multi-timeframe collaboration, and adaptive parameters, the strategy's stability and adaptability can be further enhanced.
In summary, this strategy represents a trading approach that starts from market microstructure, "seeing through" price appearances to directly analyze the internal supply-demand forces in the market, providing a unique and effective methodology for quantitative trading.
/*backtest
start: 2024-04-20 00:00:00
end: 2025-04-20 00:00:00
period: 2d
basePeriod: 2d
exchanges: [{"eid":"Futures_Binance","currency":"TRX_USD"}]
*/

//@version=5
strategy("订单流轨迹自动交易脚本", overlay=true, margin_long=100, margin_short=100, default_qty_type=strategy.percent_of_equity, default_qty_value=10)

// === 参数设置 ===- 1