RSI and SuperTrend Filter Combination System: Momentum Reversal Trading Framework with Trend Confirmation

Overview
The RSI and SuperTrend Filter Combination System is a quantitative trading strategy that combines the technical indicators RSI (Relative Strength Index) with a SuperTrend filter. The core philosophy of this strategy is "don't fight the trend — and never ignore momentum exhaustion." Operating on a 45-minute timeframe, the strategy looks for RSI overbought/oversold reversal signals, but only executes trades when price action aligns with the trend direction confirmed by SuperTrend. This combination effectively filters out a large amount of noise signals that would typically occur when using the RSI indicator alone on lower timeframes, thus improving trade quality.
Strategy Principles
The operational logic of this strategy is primarily based on the combined use of RSI and SuperTrend indicators:
- RSI Settings: Uses a 14-period RSI indicator, with the overbought line set at 65 and oversold line at 35.
- SuperTrend Settings: Calculated based on a 10-period ATR (Average True Range) with a multiplier of 3.0, used to determine price trend direction.
- Long Entry Conditions: When RSI crosses upward from the oversold zone while SuperTrend indicates a bullish trend (price above the lower band).
- Short Entry Conditions: When RSI crosses downward from the overbought zone while SuperTrend indicates a bearish trend (price below the upper band).
- Risk Management: Each trade sets a 1% stop loss and 1.5% take profit, maintaining a favorable risk-reward ratio.
The strategy uses the SuperTrend indicator to determine the overall market trend, then utilizes the RSI indicator to look for reversal opportunities in the direction of the trend. This method avoids blind counter-trend trading, improves signal quality, especially during high volatility phases. The 45-minute timeframe provides both sufficient signal quality and reasonable trading frequency.
Strategy Advantages
-
Comprehensive Filtering Mechanism: By combining RSI's overbought/oversold conditions with SuperTrend's directional filter, this strategy can maintain a high win rate while effectively filtering out market noise, providing higher quality entry signals.
-
Sound Risk Control: The strategy sets clear stop losses (1%) and dynamic take profits (1.5%) for each trade, with a risk-reward ratio better than 1:1.5, contributing to stable capital growth in the long term.
-
Rich Visual Feedback: The strategy includes clear chart visualization elements, including background zones, stop loss/take profit lines, and real-time trend bands. These designs enhance decision-making speed and clarity, allowing traders to quickly identify signals.
-
Adaptation to Volatile Markets: Unlike traditional RSI strategies, this system doesn't blindly reverse under any market conditions but focuses on capturing clear swings in structured trends, particularly suitable for trading during high volatility phases.
-
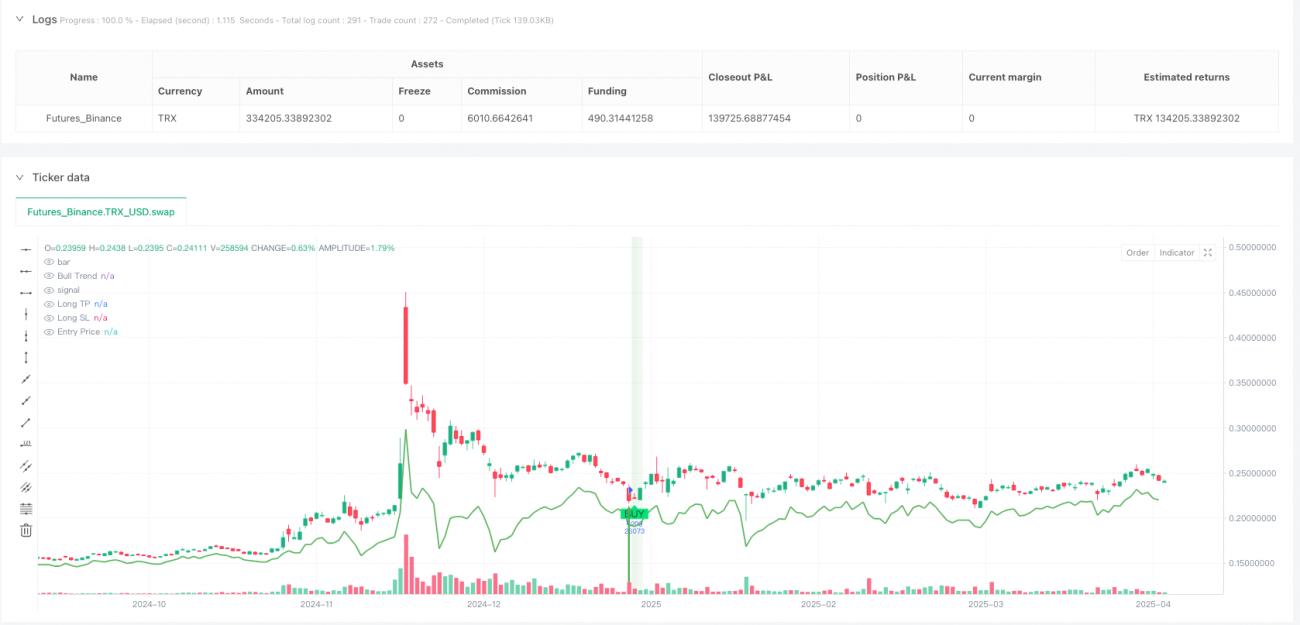
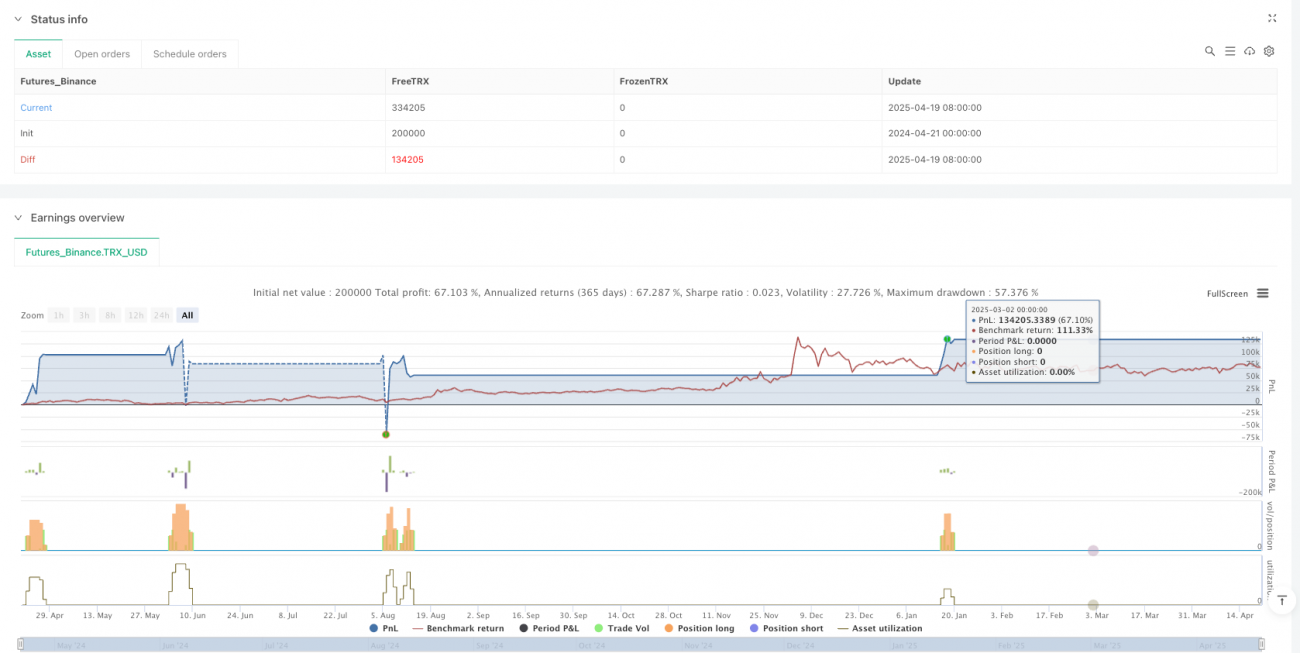
Reliable Backtesting Performance: In Bitcoin testing on the 45-minute timeframe, the strategy demonstrated a total profit of +213,885 USDT across 239 trades, with maximum drawdown controlled at 15% and a profit factor of 1.12, showing quite robust performance.
Strategy Risks
-
Poor Performance in Ranging Markets: This strategy is primarily designed for trending markets and may generate frequent false signals in sideways or range-bound conditions, leading to consecutive losses. It is recommended to apply it in clear trending markets or add market structure identification mechanisms to filter out ranging market signals.
-
Fixed Risk in Stop Loss Settings: The fixed 1% stop loss may be too small in some highly volatile markets, causing premature triggering; while in low volatility markets, it may be too large. It is advisable to dynamically adjust the stop loss percentage based on market volatility, such as setting adaptive stops based on ATR.
-
Parameter Sensitivity: RSI periods and thresholds, as well as SuperTrend's ATR period and multiplier settings, significantly impact strategy performance. Different markets and timeframes may require different parameter settings, and excessive optimization may lead to overfitting risk.
-
Lagged Response to Trend Changes: As a trend indicator, SuperTrend has a certain lag and may not adjust direction in time when trends suddenly reverse, leading to potential losses. Consider combining more sensitive trend indicators or price action analysis to optimize the ability to respond to trend changes.
-
Lack of Volume Confirmation: The existing strategy relies solely on price indicators without considering volume changes, which may reduce signal reliability. Adding volume confirmation mechanisms is recommended to improve the quality of entry signals.
Strategy Optimization Directions
-
Multi-Timeframe Analysis Integration: Higher timeframe trend confirmation (such as 4-hour or daily) can be added to ensure that the trading direction is consistent with the major trend. This "top-down" approach can significantly improve the strategy's win rate, especially near market turning points. This can be implemented by adding higher timeframe SuperTrend judgments as additional filtering conditions.
-
Adaptive Parameter Design: RSI overbought/oversold thresholds and SuperTrend multipliers can be dynamically adjusted based on market volatility. For example, expand the RSI threshold range (e.g., 30-70) in high volatility markets and narrow thresholds (e.g., 40-60) in low volatility markets. This can be achieved by calculating historical volatility and setting dynamic thresholds.
-
Incorporating Volume Analysis: Integrate volume indicators into the strategy to ensure sufficient market participation when signals occur. For example, require that volume during RSI breakouts be higher than the average of the previous N periods to filter out false breakouts with low volume.
-
Market Structure Identification: Add market structure analysis components, such as support/resistance levels or price pattern recognition, to help the strategy reduce trading frequency in ranging markets or improve entry precision in trending markets. This can be implemented by analyzing high-low point patterns or using other market structure indicators.
-
Optimizing Capital Management: Implement dynamic position sizing, adjusting position size for each trade based on signal strength, market volatility, and account performance. For example, gradually increase positions after consecutive profits and reduce positions after consecutive losses to protect capital and optimize returns.
Summary
The RSI and SuperTrend Filter Combination System is an efficient trading framework that combines momentum reversal with trend confirmation. By capturing potential reversal signals through the RSI indicator while using SuperTrend to ensure trade direction aligns with the main trend, it effectively improves entry signal quality. The strategy sets reasonable risk management parameters (1% stop loss and 1.5% take profit) and features a clear visualization interface for quick decision-making.
This strategy performs excellently in markets with clear trends and is suitable for traders seeking mechanical entry signals while providing a solid foundation for automated trading. However, performance may be suboptimal in ranging markets, and attention should be paid to parameter sensitivity and lagged response to trend changes.
Future optimization directions include integrating multi-timeframe analysis, designing adaptive parameters, adding volume confirmation, enhancing market structure recognition capabilities, and improving capital management systems. These improvements will further enhance the strategy's robustness and adaptability, enabling it to remain competitive across various market environments.
By deeply understanding and reasonably applying this strategic framework, traders can effectively capture high-quality trading opportunities in the market while maintaining risk control, achieving long-term stable trading returns.
/*backtest
start: 2024-04-21 00:00:00
end: 2025-04-20 00:00:00
period: 1d
basePeriod: 1d
exchanges: [{"eid":"Futures_Binance","currency":"TRX_USD"}]
*/

//@version=5
strategy("RSI + SuperTrend Filter Strategy (45m BTCUSDT)", overlay=true, default_qty_type=strategy.percent_of_equity, default_qty_value=100)

// === Inputs- 1