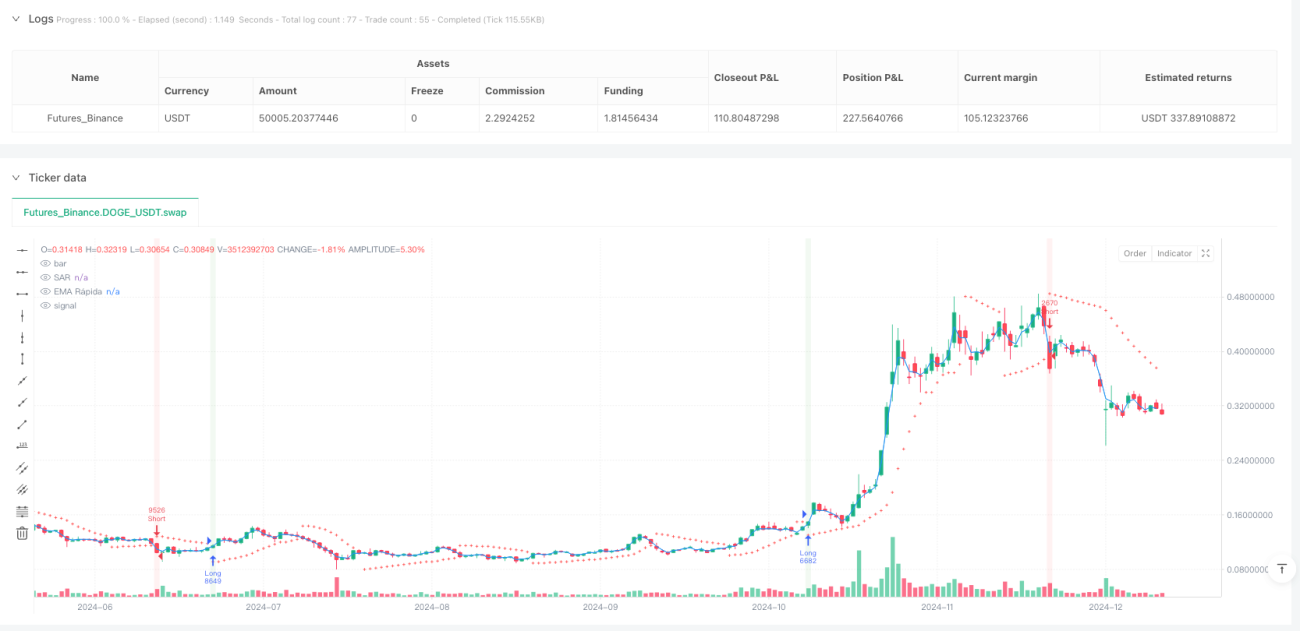
Multi-Factor Trend Following Quantitative Strategy

SAR EMA RSI ADX ATR
Created on: 2025-04-24 17:23:29 Modified on: 2025-04-24 17:23:29
Copy: 0 Number of hits: 355
avatar of ianzeng123 ianzeng123
2
Follow
319
Followers

 Multi-Factor Trend Following Quantitative Strategy  Multi-Factor Trend Following Quantitative Strategy

Overview

This strategy is a multi-factor trend-following system combining Parabolic SAR, Exponential Moving Average (EMA), Relative Strength Index (RSI), and Average Directional Index (ADX). It identifies potential trend directions through the synergistic effect of multiple technical indicators and generates trading signals upon trend confirmation. The strategy also incorporates dynamic risk management based on Average True Range (ATR) to automatically calculate stop-loss and take-profit levels.

Strategy Logic

  1. Trend Confirmation: An uptrend is confirmed when price breaks above Parabolic SAR and closes above fast EMA; a downtrend is confirmed when price breaks below SAR and closes below fast EMA.
  2. Momentum Filter: Uses RSI to filter signals, requiring RSI>60 for longs and RSI<40 for shorts, ensuring trades align with strong momentum.
  3. Trend Strength Validation: ADX (threshold 30) verifies trend strength, avoiding trades in ranging markets.
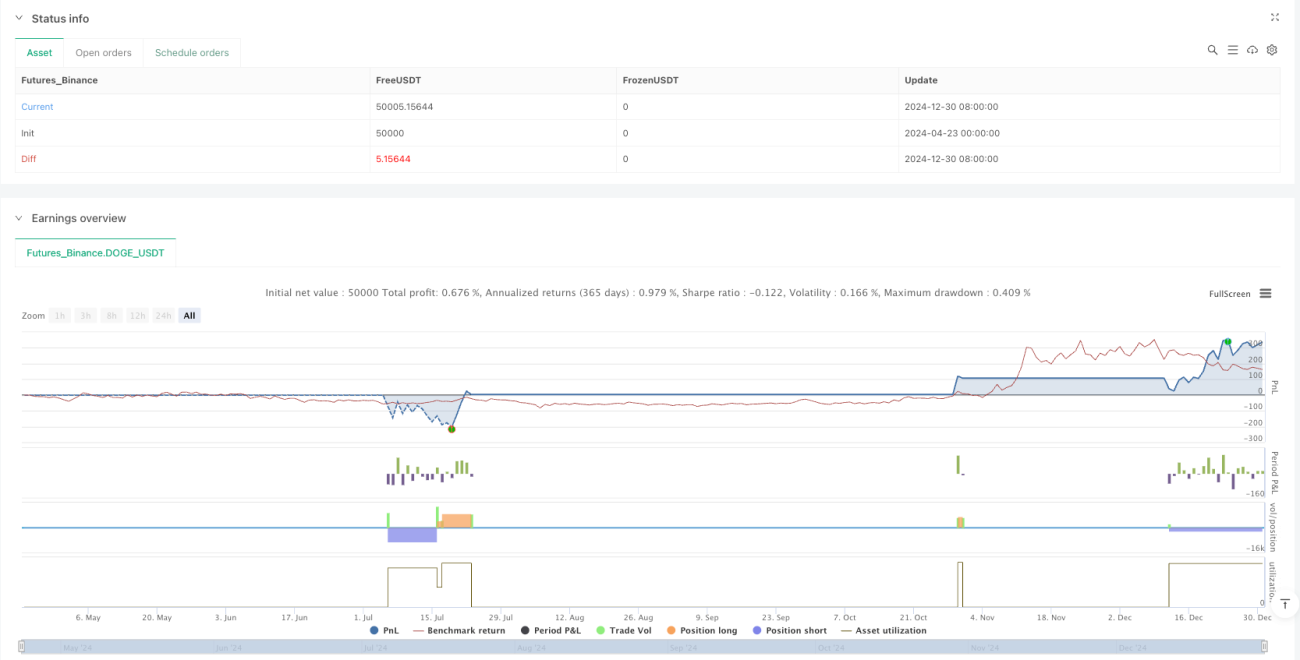
  4. Risk Management: Dynamic stops (1.5x ATR) and targets (2x ATR) based on volatility, with position sizing calculated as fixed percentage (default 2%) of account equity.

Advantages

  1. Multi-Factor Validation: Four-indicator confirmation significantly improves signal quality.
  2. Dynamic Risk Control: ATR-based stops/targets automatically adapt to changing volatility.
  3. Trend Strength Filter: ADX threshold effectively filters false breakouts.
  4. Automated Position Sizing: Risk-based sizing ensures consistent trade exposure.
  5. Clear Visual Feedback: Colored background provides intuitive signal display.

Risks

  1. Lagging Nature: SAR and EMA may lag during trend reversals.
  2. Parameter Sensitivity: Short RSI length (6) and EMA period (2) may cause overtrading.
  3. ADX Threshold Risk: Fixed ADX threshold (30) may underperform in different market regimes.
  4. Volatility Spike Risk: Fixed ATR multiplier may create excessively wide stops during extreme volatility.
    Solutions:
  • Dynamic optimization of ADX and RSI parameters
  • Add volatility filters (e.g. VIX)
  • Implement progressive position sizing

Optimization Directions

  1. Dynamic Parameters: Replace fixed values with market-condition-adjusted parameters.
  2. Machine Learning: Use historical data to train optimal parameter combinations.
  3. Multi-Timeframe Confirmation: Incorporate higher timeframe trend validation.
  4. Event Volatility Filters: Pause trading around major news events.
  5. Composite Exits: Combine trailing stops, time exits and other exit mechanisms.

Conclusion

This multi-factor trend strategy excels in trending markets through indicator synergy and rigorous risk control. Its core strengths lie in multi-layered signal validation and dynamic risk management, though parameter sensitivity and lag risks require attention. Future optimizations should focus on adaptive parameter mechanisms and market regime detection to enhance robustness.

Strategy source code
/*backtest
start: 2024-04-23 00:00:00
end: 2024-12-31 00:00:00
period: 1d
basePeriod: 1d
exchanges: [{"eid":"Futures_Binance","currency":"DOGE_USDT"}]
*/

//@version=5
strategy("πŸš€ Estrategia SAR+EMA+RSI con Alertas", overlay=true)

// β€”β€”β€”β€” PARÁMETROS β€”β€”β€”β€”
riskPerTrade = input.float(2.0, title="Riesgo por operaciΓ³n (%)", minval=0.5, step=0.5)
sarStart = input.float(0.02, title="SAR Start", minval=0.001)
sarIncrement = input.float(0.02, title="SAR Increment", minval=0.001)
sarMax = input.float(0.2, title="SAR Max", minval=0.1)
rsiLength = input.int(6, title="RSI Length", minval=3, maxval=10)
emaFastLength = input.int(2, title="EMA RΓ‘pida", minval=1, maxval=5)
adxThreshold = input.int(30, title="ADX mΓ­nimo", minval=20, maxval=50)
atrMultiplier = input.float(1.5, title="Multiplicador ATR para SL", step=0.1)

// β€”β€”β€”β€” INDICADORES β€”β€”β€”β€”
sar = ta.sar(sarStart, sarIncrement, sarMax)
emaFast = ta.ema(close, emaFastLength)
rsi = ta.rsi(close, rsiLength)
[diplus, diminus, adx] = ta.dmi(14, 14) // Ahora pasamos length y adxSmoothing

atr = ta.atr(14)

// β€”β€”β€”β€” CONDICIONES β€”β€”β€”β€”
longCondition = ta.crossover(close, sar) and close > emaFast and rsi > 60 and adx >= adxThreshold
shortCondition = ta.crossunder(close, sar) and close < emaFast and rsi < 40 and adx >= adxThreshold

// β€”β€”β€”β€” FUNCIΓ“N MENSAJE ALERTA β€”β€”β€”β€”
getAlertMessage(isLong) =>
    slPoints = atr * atrMultiplier
    message = (isLong ? "πŸš€ COMPRA " : "πŸ”» VENTA ") + syminfo.ticker + "\n" +
      "Precio: " + str.tostring(math.round(close, 2)) + "\n" +
      "SL: " + str.tostring(math.round(isLong ? (close - slPoints) : (close + slPoints), 2)) + "\n" +
      "TP: " + str.tostring(math.round(isLong ? (close + slPoints * 2) : (close - slPoints * 2), 2)) + "\n" +
      "RSI: " + str.tostring(math.round(rsi, 1)) + "\n" +
      "ADX: " + str.tostring(math.round(adx, 1))
    message

// β€”β€”β€”β€” ALERTAS β€”β€”β€”β€”
if (longCondition)
    alert(getAlertMessage(true), alert.freq_once_per_bar_close)

if (shortCondition)
    alert(getAlertMessage(false), alert.freq_once_per_bar_close)


if (longCondition)
    alert(getAlertMessage(true), alert.freq_once_per_bar_close)

if (shortCondition)
    alert(getAlertMessage(false), alert.freq_once_per_bar_close)

// β€”β€”β€”β€” ENTRADAS DE ESTRATEGIA β€”β€”β€”β€”
riskAmount = strategy.equity * (riskPerTrade / 100)
slPoints = atr * atrMultiplier
qty = riskAmount / close

if (longCondition)
    strategy.entry("Long", strategy.long, qty=qty)
    strategy.exit("Exit Long", "Long", stop=close - slPoints, limit=close + slPoints * 2)

if (shortCondition)
    strategy.entry("Short", strategy.short, qty=qty)
    strategy.exit("Exit Short", "Short", stop=close + slPoints, limit=close - slPoints * 2)

// β€”β€”β€”β€” VISUALIZACIΓ“N β€”β€”β€”β€”
plot(sar, title="SAR", color=color.red, style=plot.style_cross)
plot(emaFast, title="EMA RΓ‘pida", color=color.blue)
bgcolor(longCondition ? color.new(color.green, 90) : shortCondition ? color.new(color.red, 90) : na)